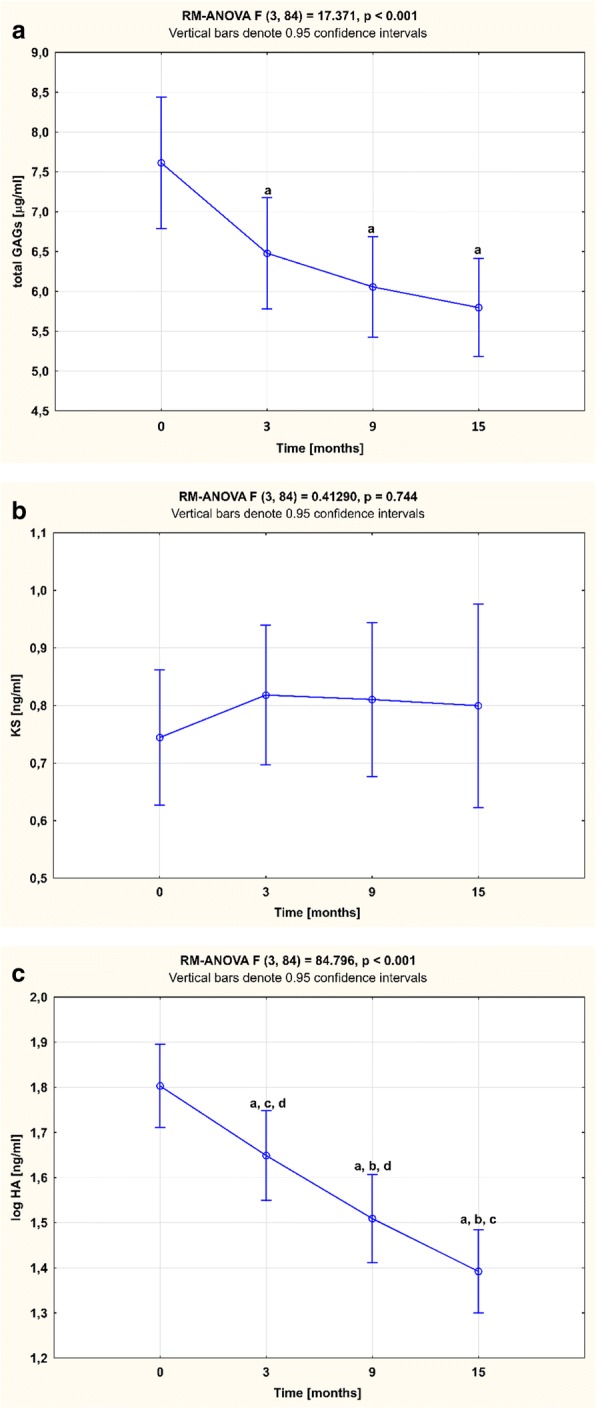
Fig. 2.

Temporal course of plasma (a) GAGs, (b) KS, and (c) HA levels in RA patients (n = 29) during 15-month anti-TNF-α therapy . Results expressed as mean (SD). Data analyzed using one-way RM-ANOVA, followed by Tukey’s multiple comparisons test. ap < 0.001, compared to baseline (T0); bp < 0.001, compared to 3 months after therapy (T1); cp < 0.001, compared to 9 months after therapy (T2); dp < 0.001, compared to 15 months after therapy (T3). GAG glycosaminoglycan, HA hyaluronic acid, KS keratan sulfate, RM-ANOVA repeated measures analysis of variance
