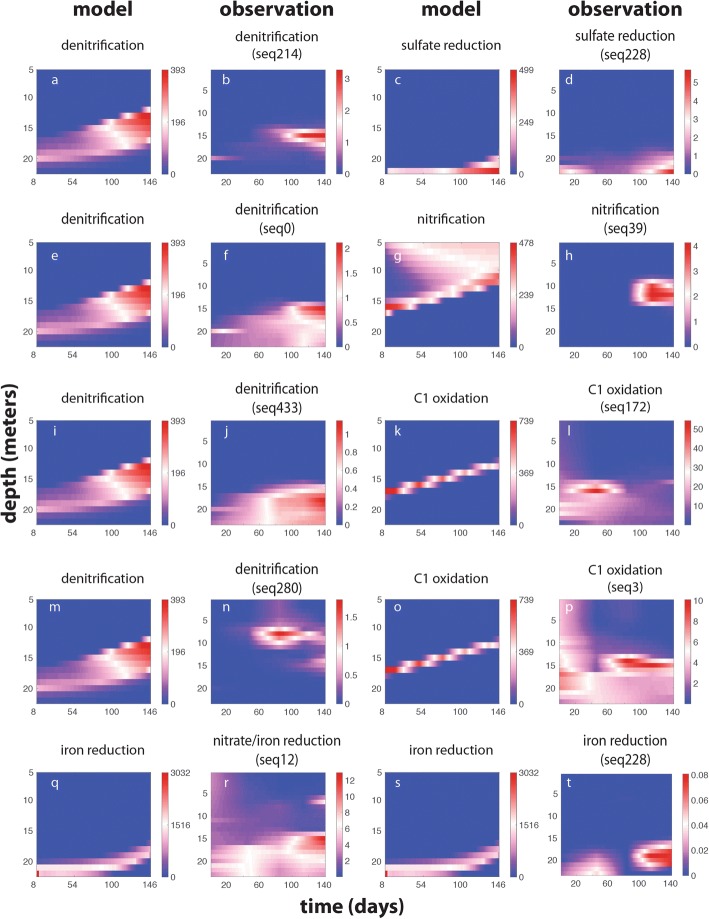
Fig. 4.
a–t Dynamics of populations capable of mediating the modeled processes. The spatiotemporal distribution of OTUs (second and fourth column) and associated processes predicted by the model (first and third column, respectively). Each panel has a its own key to the right of the graph indicating the color coding specific to each graph for the relative abundance (percent of total) of each OTU or rate (μM y-1) of each process. The model was not calibrated using OTU dynamics; thus, the relationship between the model and observations suggests that the availability of energy is an underlying factor driving the spatiotemporal dynamics of the most abundant and active microorganisms in the lake

