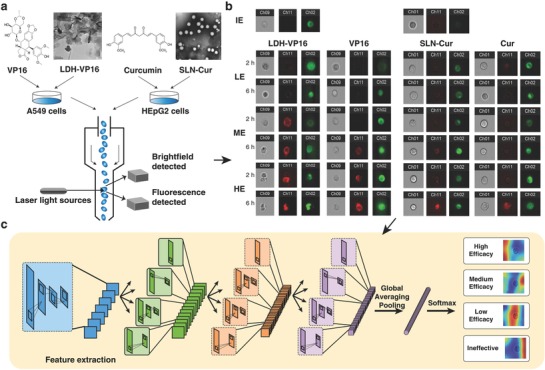
Figure 1.

An overview of the DeepScreen workflow. a) A549 and HEpG2 cells were treated with several concentrations of VP16/LDH‐VP16 and Cur/SLN‐Cur, separately. TEM photos of LDH‐VP16 and SLN‐Cur were shown, and the scale bar was 100 nm and 0.2 µm, separately. Then after 2 and 6 h, cells were stained with Annexin V‐APC, collected and managed by image flow cytometry. A549 cells were stained by anti‐EGFR‐FITC after Annexin V progress. b) Bright‐field and dark‐field images (Annexin V‐APC channel shows red, while anti‐EGFR‐FITC was green) were obtained, respectively. For HEpG2 cells, the green channel presents the fluorescence interference of Curcumin. IE, LE, ME, and HE present ineffective, low, medium, and high efficacy, respectively. c) Gained images were used as training data for the screening system, a schematic of the convolutional neural network (CNN) was demonstrated. The procedure of class activation mapping (CAM) technique was also shown.
