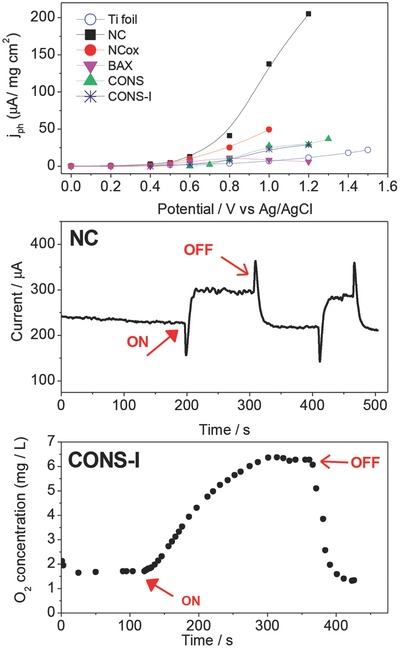
Figure 16.

Top: Photocurrent versus bias potential of nanoporous carbons photoanodes exposed to simulated solar light; Middle: chronoamperometric response of carbon NC photoanode upon on/off illumination at +1 V versus Ag/AgCl, showing the square‐shaped profile and the cathodic/anodic shoots. Reproduced with permission.79 Copyright 2017, Elsevier. Bottom: Oxygen evolution during the chronoamperometric runs of sample CONS‐I. Reproduced with permission.70 Copyright 2014, Elsevier.
