
Fig. 3.
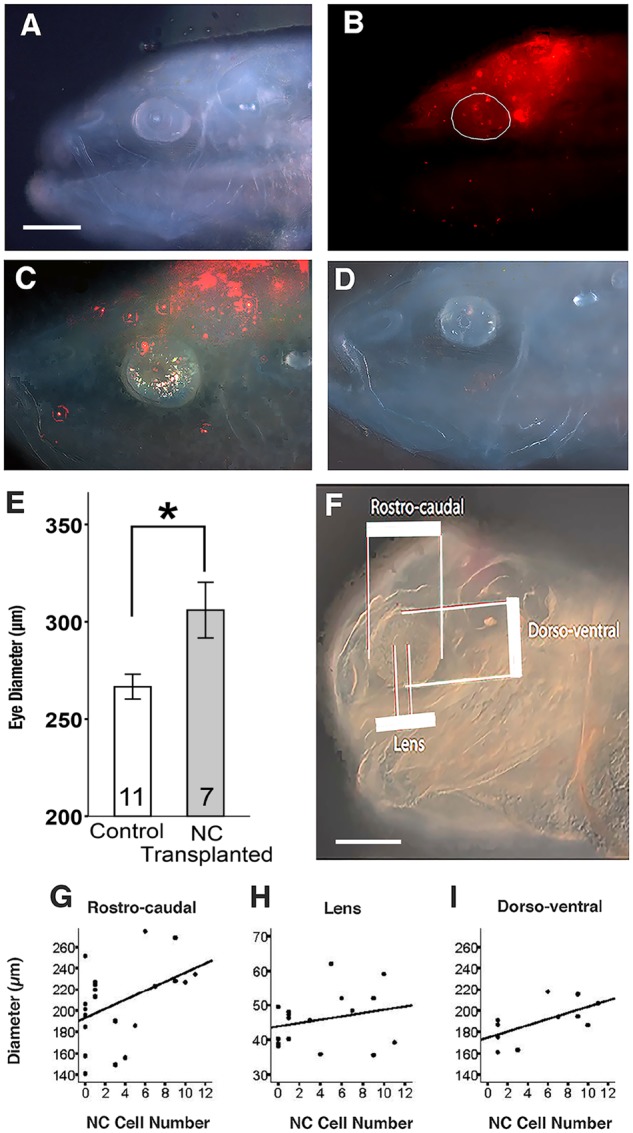
Incorporation of transplanted surface fish cranial neural crest cells into the eyes of cavefish hosts and effects on eye size. (A, B) Distribution of DiI labeled cells from a surface fish graft in the dorsal head and eyes of a cavefish host at 8 dpf. Bright field (A) and fluorescence (B) images of the same individual. The eye is circled in B. (C, D) Fluorescence images of 14 dpf cavefish host with a surface fish cranial neural crest graft (C) and a sham-operated cavefish control (D) showing the differences in eye size. Scale bar: 200 µm. In B–D, N = 8 transplantations. (E) A bar graph showing the effects of surface fish cranial neural crest transplantations on eye size in cavefish hosts at 14 dpf compared to sham operated cavefish controls. Error bars indicate standard errors of the means. The number of host or sham operated cavefish analyzed are shown at the base of the columns. *Mann–Whitney U test = 14.0; P = 0.0265. Note: the eye diameters of surface fish hosts containing surface fish cranial neural crest grafts and sham operated surface fish controls did not show any significant differences: Mann–Whitney U = 14.5; P = 0.589, N = 9 and 4, respectively. (F) Bright field image of a 14-dpf cavefish host illustrating areas measured in the regression analysis. Scale bar: 200 µm. (G–I) Regression analysis of neural crest (NC) cell number in the eyes versus rostro-caudal eye diameters (G), lens diameters (H), and dorso-ventral eye diameters (I). R2, P, and N values for G–I are 0.195, 0.045, and 21 for G (rostro-caudal diameter), 0.060, 0.342, and 17 for I (lens diameter), and 0.388, 0.041, and 11 for H (dorso-ventral diameter), respectively.