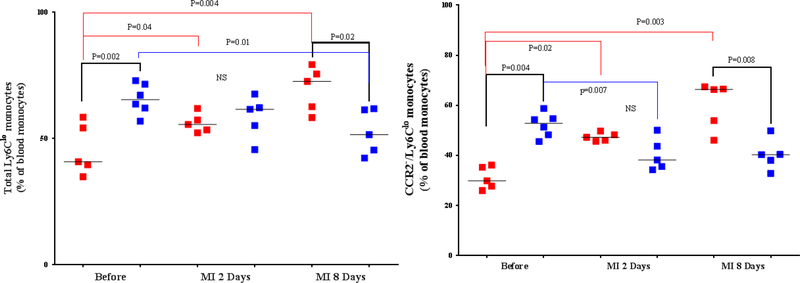
Figure 4. Phenotype of Monocytes in Peripheral Blood From the 2 Mouse Genotypes.
Peripheral blood was collected from the 2 mouse genotype groups before and at the indicated days after MI, stained with the appropriate antibodies, and analyzed by flow cytometry, essentially as described in Figure 3 using the gating strategy outlined in Online Figure 4. Each panel depicts a specific cell subset based on the expression of cell markers; (A) Left: CCR2+/Ly6Chi monocytes; right: CCR2−/Ly6Chi monocytes. (B) Left: total Ly6Clo monocytes; right: CCR2−/Ly6Clo monocyte subset. Each data point represents a blood sample from an individual mouse. The number of animals in each group is equal to the number of dots/group. MI = myocardial infarction; NS = not significant.


