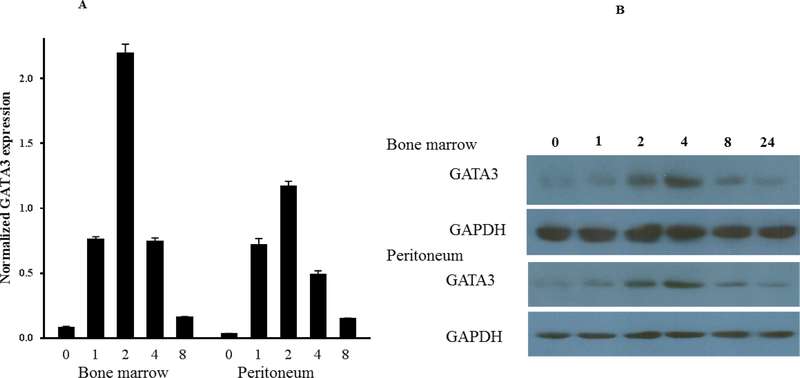
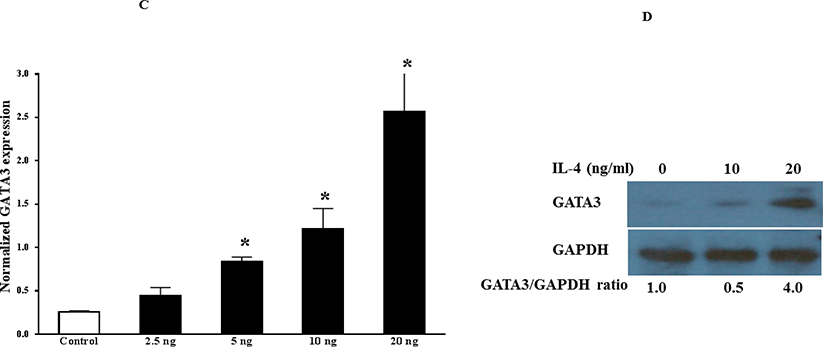
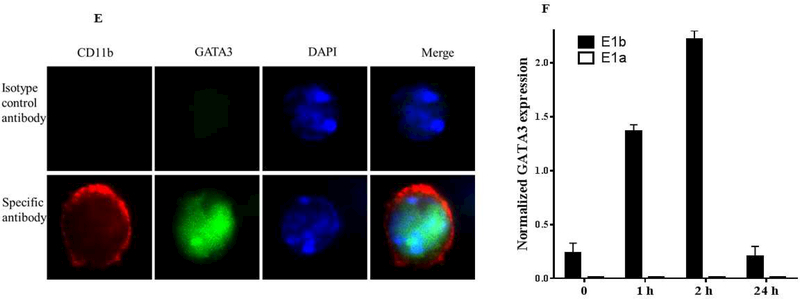
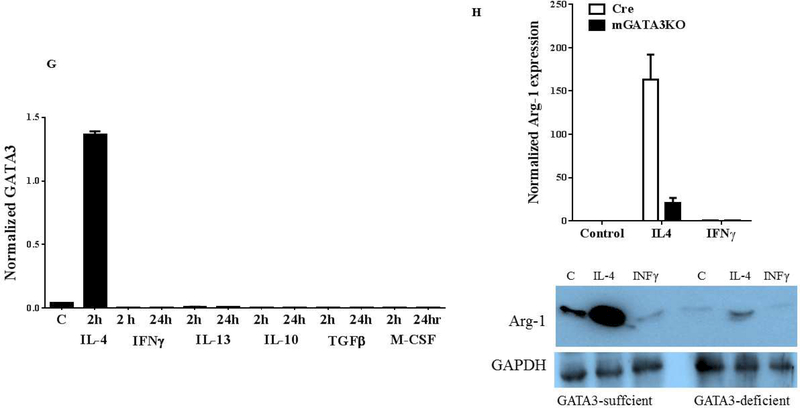
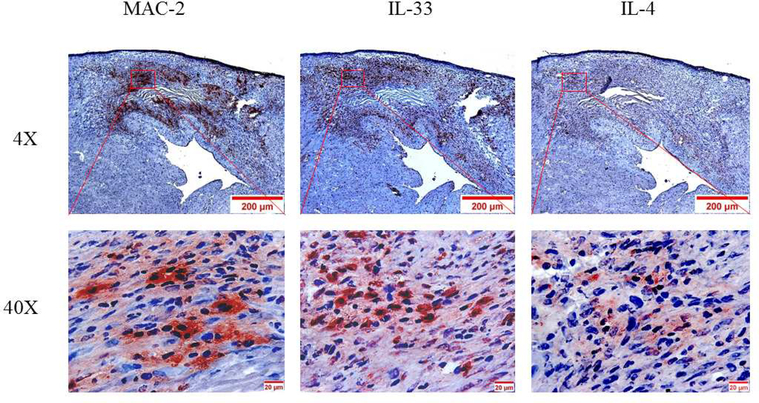
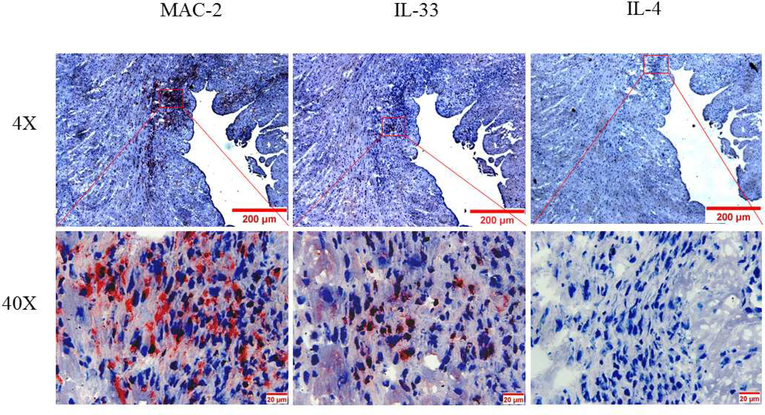
Figure 5. Mechanism of GATA3 Expression in Macrophages.
(A) Macrophages were isolated from the peritoneum or the bone marrow of control Cre mice and cultured. Cultured cells were treated with IL-4 at the indicated times, and GATA3 expression was evaluated by qPCR. GATA3 gene expression data were normalized against GAPDH. Results are the mean of triplicate determinations ± SD. (B) Proteins were extracted from cells treated with 20 ng/ml of IL-4 at the indicated times. (C) Dose-response analysis of GATA3 expression was determined by qPCR using cultured macrophages isolated from the bone marrow of control mice. (D) Proteins were analyzed by western blot analysis of lysates from cells treated with 10 or 20 ng/ml of IL-4. (E) Bone marrow-derived macrophages were plated onto chamber slides and treated with 20 ng/ml IL-4 for 4 h, followed by staining with the indicated fluorescent antibodies. Isotypematched antibodies were used as controls. (F) Total RNA was isolated from cultured bone marrow-derived macrophages from Cre mice treated with IL-4 at the indicated times and analyzed by qPCR using primers specific to the proximal (E1b) or distal (E1a) GATA3 promoter. GATA3 gene expression data were normalized against the GAPDH gene. (G) Cultured bone marrow-derived macrophages were treated with the indicated agonists for 2 and 24 h. Total RNA was extracted and analyzed by qPCR, and the resulting GATA3 data were normalized against GAPDH. (H) Cultured bone marrow-derived macrophages from the indicated mouse genotype were treated with IL-4 or IFNγ for 2 h, followed by isolation of total RNA. qPCR data for Arg-1 expression were normalized against GAPDH gene expression. In addition, proteins were extracted from the treated cells and analyzed by western blot using an antibody to Arg-1. All qPCR results are means of triplicate determinations ± SD. *Indicates a significant difference between control and treated cells, p < 0.05. (I) Representative immunostaining data for IL-4 or IL-33 expression in LV sections from control mice at 8 days post-MI. (J) Representative immunostaining of the LV section from the mGATA3KO mice stained with antibodies to Mac-2, IL-4, or IL-33. The upper panels show low magnification and the lower panels show high magnification. Arg-1 = arginase-1; GAPDH = glyceraldehyde 3-phosphate dehydrogenase IFN = interferon; IL = interleukin; qPCR = quantitative real-time polymerase chain reaction. Other abbreviations as in Figure 1.

