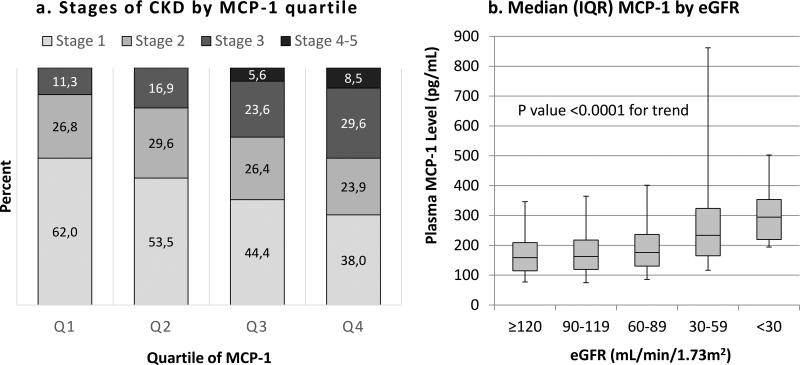
Figure 2. Relationship between plasma MCP-1 and kidney function.
(a) Distribution of stages of CKD by quartile of plasma MCP-1. (b) Median plasma MCP-1 levels by eGFR. Boxes represent the median values and interquartile ranges (IQR). Error bars represent the 5th and 95th percentiles. CKD, chronic kidney disease; eGFR, estimated glomerular filtration rate; MCP-1, monocyte chemoattractant protein-1.

