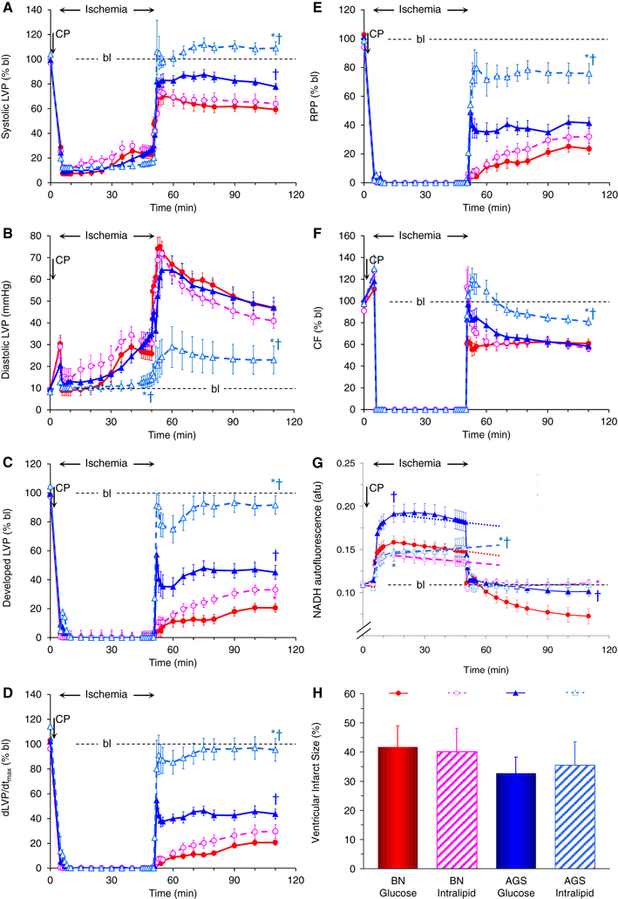
Fig 1.

shows the time courses of A) systolic (in % baseline, bl), B) diastolic (in mmHg), and C) developed (systolic – diastolic, in % bl) left ventricular pressure (LVP), D) dLVP/dtmax (in % bl), E) the rate-pressure-product (RPP, in % bl), F) coronary flow (CF, in % bl), and G) NADH autofluorescence (in arbitrary fluorescence units, afu) before, during, and 45 minutes of global no-flow in hearts isolated from Brown Norway (BN) rats (blue triangles) compared with hearts isolated from arctic ground squirrels (AGS, red circles) perfused with either 7.5 mM glucose only (closed symbols, continuous lines) or 7.5 mM glucose and 1% Intralipid™ (open symbols, interrupted lines). Panel H shows ventricular infarct size (in %) for each of the four groups. CP: perfusion with cardioplegia for 5 minutes before ischemia. Dotted and interrupted straight lines in panel G represent average change in NADH fluorescence from 10 to 45 minutes of ischemia. Statistical symbols for P < 0.05 are * vs glucose only, and † vs BN
