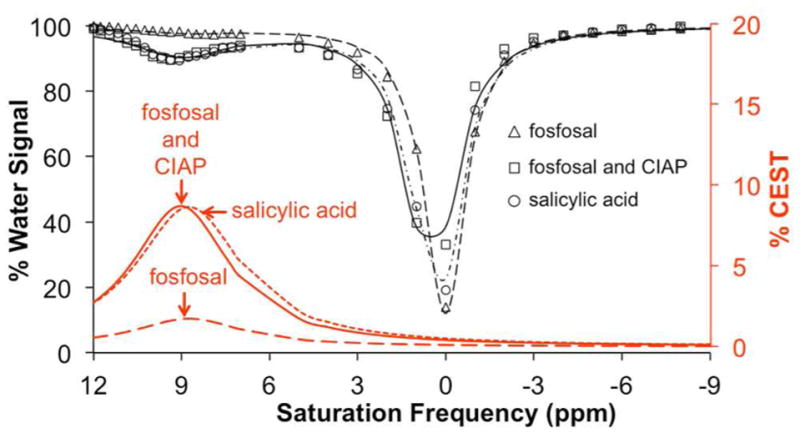
Figure 2.

CEST spectra of fosfosal before and after catalysis with calf intestinal alkaline phosphatase (CIAP). Spectra are shown for samples of 20 mM salicylic acid (circle, short dashed red line), 20 mM of fosfosal incubated with CIAP (square, solid red line), and 20 mM of fosfosal with no enzyme (triangle, long dashed red line) for 30 min at 37 °C, pH = 7.4 ± 0.05, saturation power = 3.5 μT, and saturation time = 4 s.
