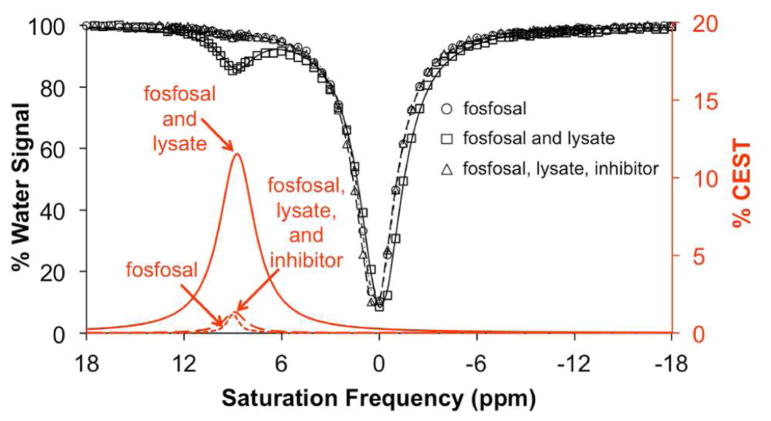
Figure 5.
CEST spectra of fosfosal before and after catalysis with cell lysate. Spectra are shown for 27 mM fosfosal (triangle and short dashed red line), 27 mM fosfosal with lysate (square and solid red line), and 27 mM fosfosal with lysate pretreated with the inhibitor cocktails (circle and long dashed red line) with pH of 7.40 ± 0.05 were incubated with lysate solution for 3 h at 25 °C.

