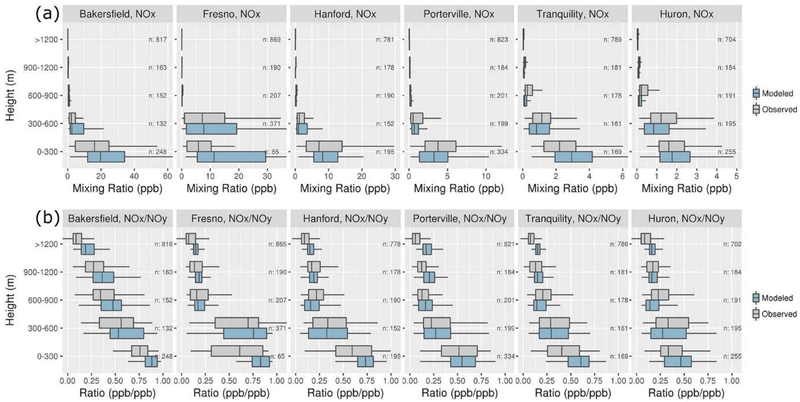
Figure 5.
Comparison of modeled and measured (a) NOy and (b) NOx/NOy mixing ratio distributions for 300-m altitude ranges for P-3B aircraft spirals (see Figure 4a for site locations). Boxes bracket the interquartile range (IQR), lines within the boxes represent the median, and whiskers represent 1.5 times the IQR from either end of the box.

