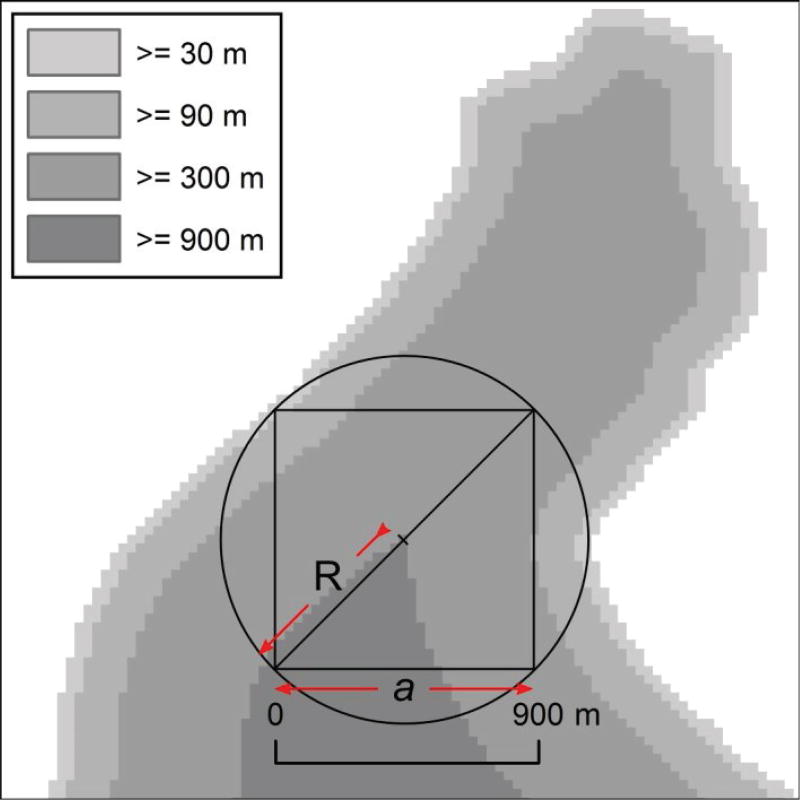
Fig. 3.
This example estimation of lake, reservoir and pond satellite spatial coverage, where a was the window width and R was the radius of the circle that circumscribes the pixel(s). The example is shown for a window width of 900 m, representing a 3×3-pixel array of 300 m MERIS pixels. Shading indicates the maximum window width that can be accommodated as specified in the legend.

