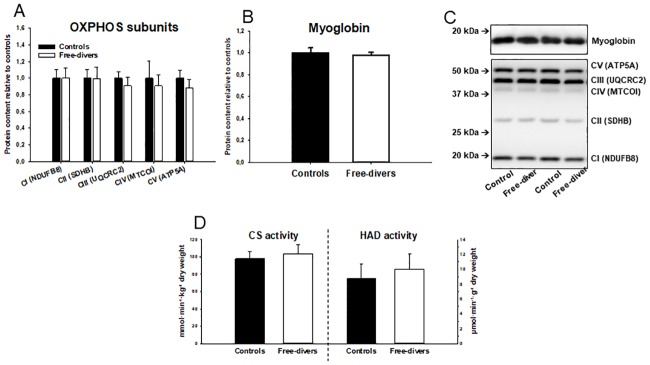
Fig 3. A-D. OXPHOS, Myoglobin and HAD activities.
(A) Specific content of OXPHOS CI (NDUFB8 = NADH dehydrogenase [ubiquinone] 1 beta subcomplex subunit 8) divers 1.0 ± 0.1 vs controls 1.0 ± 0.1, CII (SDHB = Succinate dehydrogenase [ubiquinone] iron-sulfur subunit) divers 1.0 ± 0.1 vs controls 1.0 ± 0.1, CIII (UQCRC2 = ubiquinol-cytochrome c reductase complex) divers 0.9 ± 0.1 vs controls 1.0 ± 0.1, CIV (MTCOI = mitochondrial cytochrome oxidase I) divers 0.9 ± 0.1 vs controls 1.0 ± 0.2, CV (ATP5A = ATP synthase subunit alpha) divers 0.9 ± 0.1 vs controls 1.0 ± 0.1. (B) Specific content of myoglobin divers 1.00 ± 0.03 vs. controls 1.00 ± 0.03. (C) SDS-page and western blot for determination of myoglobin. (D) Maximal CS (citrate synthase) activity divers 103.9 ± 10.0 vs. controls 98,0 ± 8.4 and HAD (3-hydroxyacyl CoA dehydrogenase) activity divers 10.0 ± 2.0 vs. controls 8.8 ± 2.0.

