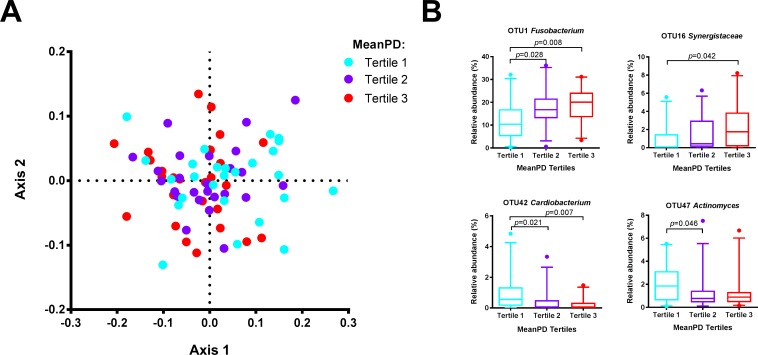
Fig 2. Association between mean probing depth (PD) and subgingival microbiome of rheumatoid arthritis (RA) patients.
(A) nMDS plot based on two-dimensional Bray-Curtis similarity index (stress 0.1982, PERMANOVA: p = 0.038, F = 1.6). Pairwise comparisons: the samples with the deepest probing depths (PD tertile 3) vs the samples with the shallowest probing depths (PD tertile 1): p = 0.039. Samples in the lowest tertile of PD (2.2–2.5 mm) = aqua dots; samples in the middle tertile of PD (2.6–2.8 mm) = purple dots; highest tertile of PD (2.8–4.4 mm) = red dots. (B) Boxplots of the most abundant and significant 20 OTUs (S4B Table) that significantly associated with mean PD by linear discriminant analysis effect size (LEfSe) analysis. P values are based on Wilcoxon rank-sum test. The boxplots show medians, the error bars indicate 5–95% confidence interval. The connectors show statistically significant differences (p<0.05).

