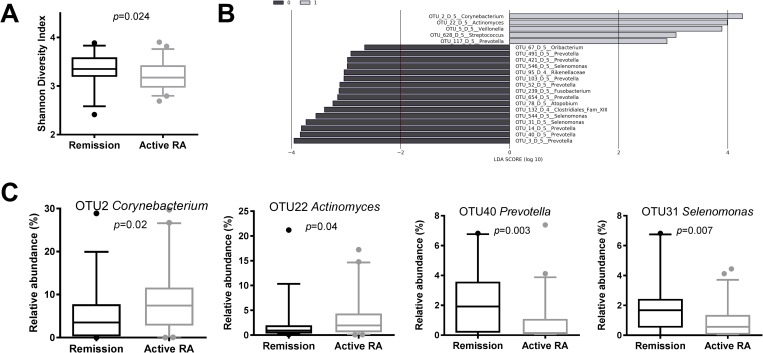
Fig 3. Association between RA disease activity status and subgingival microbiome.
(A) Shannon Diversity index by RA activity status. DAS28 score ≥2.6 = individuals with active RA (N = 60), DAS28 score <2.6 = individuals in RA remission (N = 28). P value is based on Mann-Whitney test. (B) Differentially discriminatory OTUs (N = 21) by RA disease activity status, as identified by linear discriminant analysis effect size (LEfSe) analysis. Active RA = grey bars; RA remission = black bars. (C) Boxplots of the most abundant and significant 21 OTUs (S4E Table) that significantly associated with RA disease activity status by LEfSe analysis. P values are based on Wilcoxon rank-sum test. Active RA = grey boxplots; RA remission = black boxplots. The boxplots show medians, the error bars indicate 5–95% confidence interval. The connectors show statistically significant differences (p<0.05).

