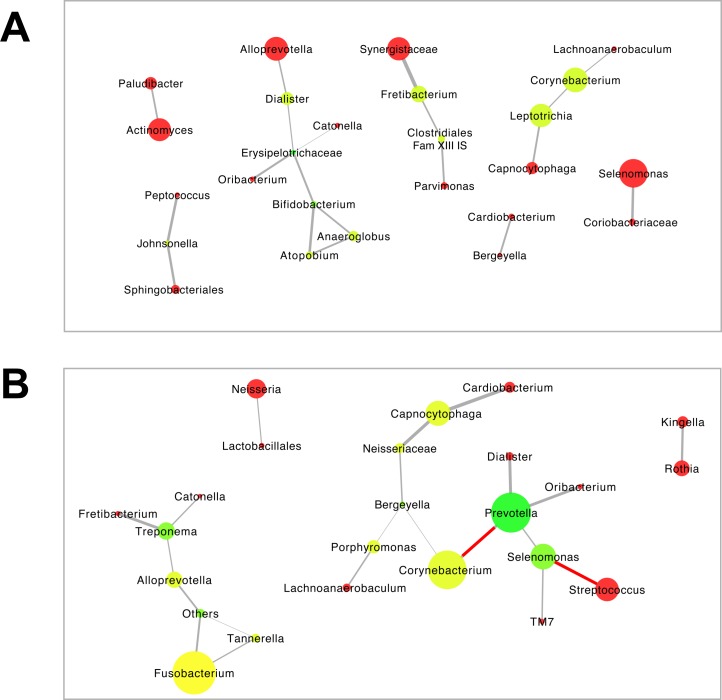
Fig 6. Bacterial co-occurrence or mutual exclusion networks by subgingival microbial community type in RA patients.
(A) community type 1 = CT1. (B) community type 2 = CT2. (S1 and S2 Tables). Only edges that were significant by at least two of the methods (i.e. Pearson and Spearman correlations, Bray-Curtis similarity and Kullback-Leibler divergence) after correction for multiple comparisons were included in the network. The grey lines indicate positive correlations, and the negative correlations are indicated in red (p < 0.05). The size of the node is indicative of the relative abundance of the respective genus. The color of the node indicates the number of connections (neighbors) in the range of red to green; red indicates one connection, while green indicates ≥3 connections.

