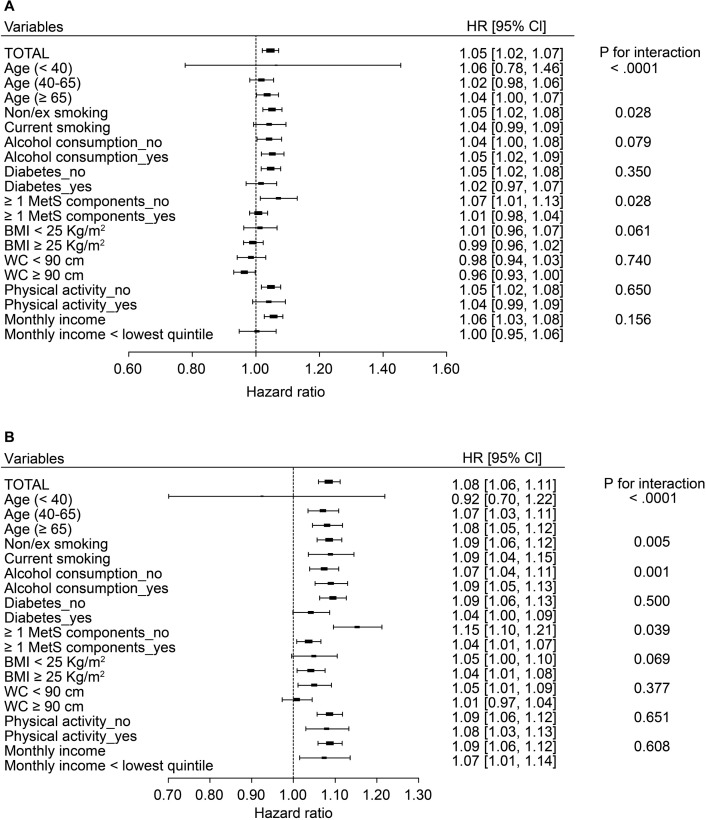
Fig 2. The impact of on the risk nonalcoholic fatty liver disease of prostate cancer in different subgroups.
Forrest plots of hazard ratios (HR) and 95% confidential interval (CI) adjusted for age, smoking, drinking, regular exercise, income according to subgroups were illustrated. Fatty liver index (a) or hepatic steatosis index (b) was used to define the nonalcoholic fatty liver disease.

