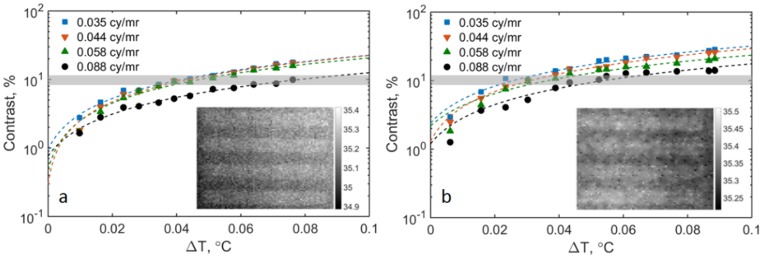
Fig 8. Contrast versus ΔT for (a) IRT-1 and (b) IRT-2.
Shaded horizontal bar represents the lowest visible contrast of 10%. The 4-bar target (conjugate bars) maintained at 35°C and positioned in the horizontal direction at distance of 0.35m. Insets show sample thermograms at MRTD threshold for spatial frequency of 0.035 cycles/mrad.

