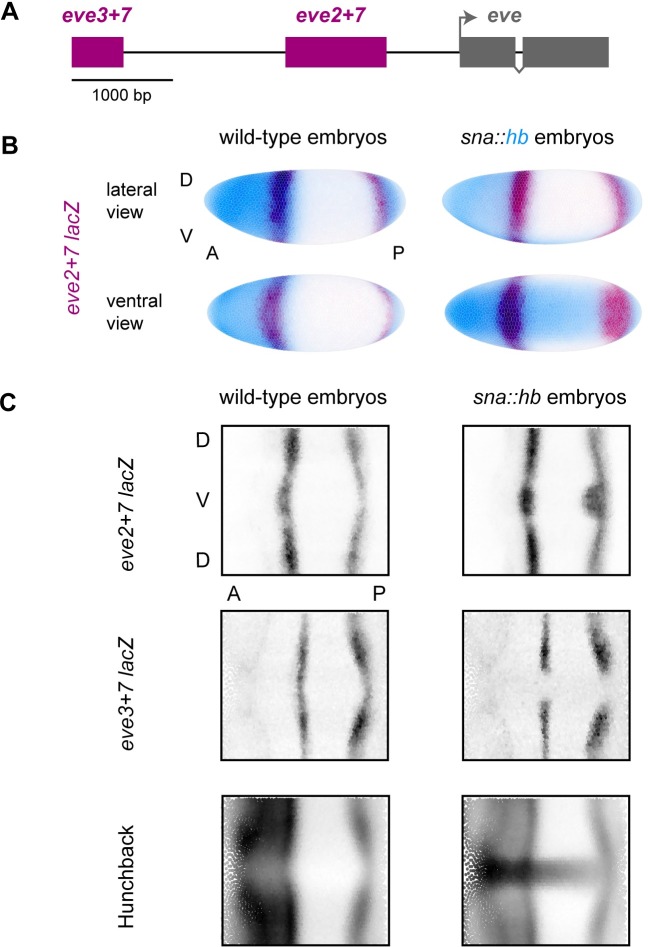
Fig 1. Quantitative gene expression data in wild-type and sna::hb embryos.
(A) Diagram of the upstream half of the even-skipped locus. Enhancers are indicated in maroon, and coding sequence is indicated in grey. (B) We created transgenic lines containing lacZ reporter constructs for eve enhancers and measured gene expression in wild-type embryos and embryos misexpressing ventral hb (sna::hb embryos). Here, we show visual renderings [74] of gene expression atlas data that average measurements from multiple embryos in timepoint 4 (25–50% membrane invagination) [43]. Dorsal (D) and ventral (V) surfaces are indicated for the lateral view, as are anterior (A) and posterior (P) positions. Left: eve2+7 lacZ expression (maroon) in wild-type embryos; Right: eve2+7 lacZ in sna::hb embryos. Hb protein is shown in blue. Individual nuclei are outlined, and darker coloring indicates higher relative expression level. (C) To help visualize all relevant nuclei, we show 2-dimensional projections of expression data throughout this manuscript. Positions of individual nuclei along the dorsal-ventral (DV) axis are plotted as a function of position along the anterior-posterior (AP) axis. Darker color indicates higher expression for each nucleus. Relative expression values are normalized to the maximum value and range from 0 to 1.

