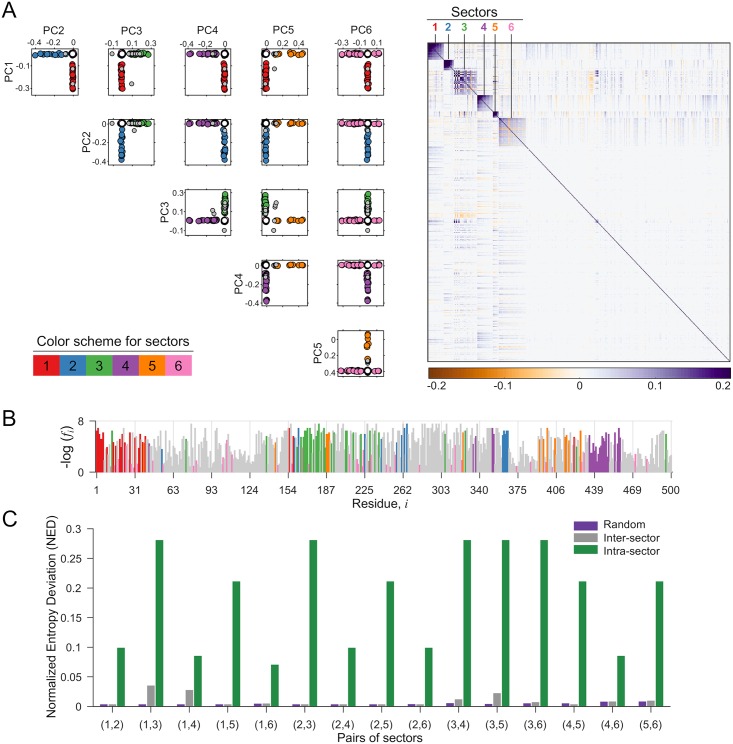
Fig 3. Co-evolutionary sectors revealed by RoCA for HIV Gag.
(A) Biplots of the robustly estimated PCs that are used to form RoCA sectors. The sector residues are represented by circles according to the specified color scheme, while overlapping residues (belonging to more than one sector) and independent (non-sector) residues are represented as gray and white circles, respectively. The heat map of the cleaned correlation matrix (Materials and methods), with rows and columns ordered according to the residues in the RoCA sectors, shows that the sectors are notably sparse and uncorrelated to each other. (B) Location of RoCA sector residues in the primary structure of HIV Gag. The sector residues are colored according to the specifications in (A) while remaining residues are shown in gray color. The vertical axis shows the negative log-frequency of mutation for each residue i. (C) Statistical independence of sectors using the normalized entropy deviation (NED) metric. It is a non-negative measure which is zero if two sectors are independent, while taking a larger value as the sectors become more dependent (see Materials and methods for details). For each possible pair of sectors, the inter-sector NED is very small and generally close to the randomized case, while being substantially lower than the maximum intra-sector NED of any individual sector in the considered pair, reflecting that sectors are nearly independent. Corresponding results for the other three proteins are presented in S1 Fig.

