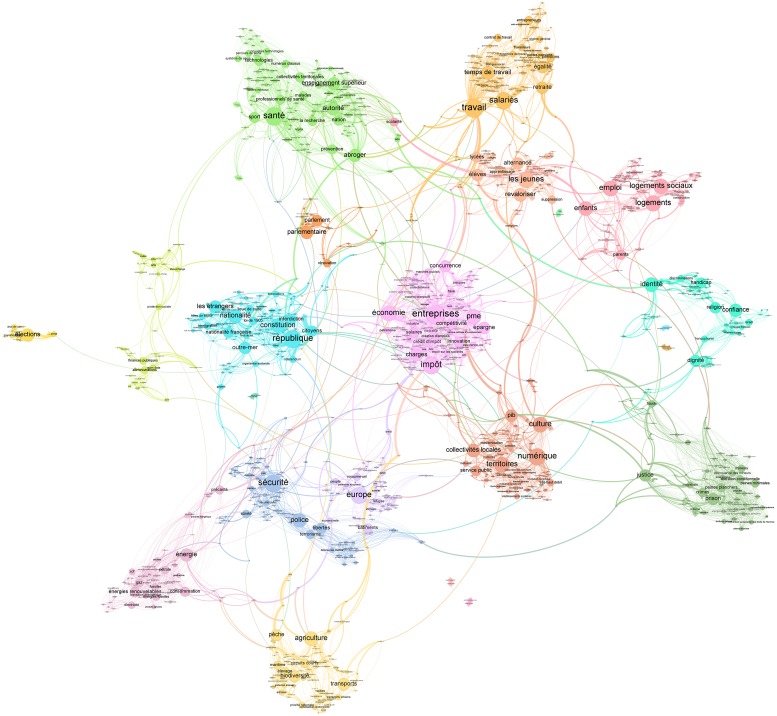
Fig 3. Map of the themes covered in the 2017 presidential programs, drawn-up using Gargantext.
The map has been built from policy measures extracted from the candidates’ programs. The nodes of the map are labels for groups of terms deemed equivalent in political discourse. The link between a label A and a label B indicates that the probability that A and B are jointly mobilized in the same political measure is high. Gargantext applies the Louvain algorithm to identify clusters of labels with strong interaction between them and displays them in the same color. To improve readability, the map was edited in the Gephi software (https://gephi.org) to set the size of nodes and labels according to a monotonous function of their PageRank [50]. File A3 at DOI: 10.7910/DVN/AOGUIA provides an editable version of this map (gexf).

