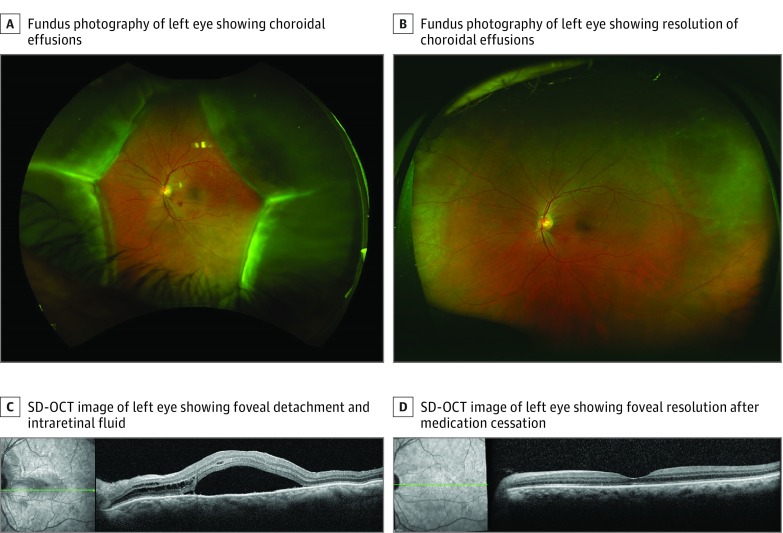
Figure 1. Images From Patient 1 at Presentation and After Cessation of Antiprogrammed Cell Death Protein-1/Antiprogrammed Cell Death Ligand-1 (Anti-PD-1/Anti-PD-L1) Therapy.
A and C, Images from patient 1 at initial presentation; B and D, Images from patient 1 after cessation of anti-PD-1/PD-L1 therapy. A, Fundus photography of the left eye showing choroidal effusions in all 4 quadrants; SD-OCT indicates spectral-domain optical coherence tomography.

