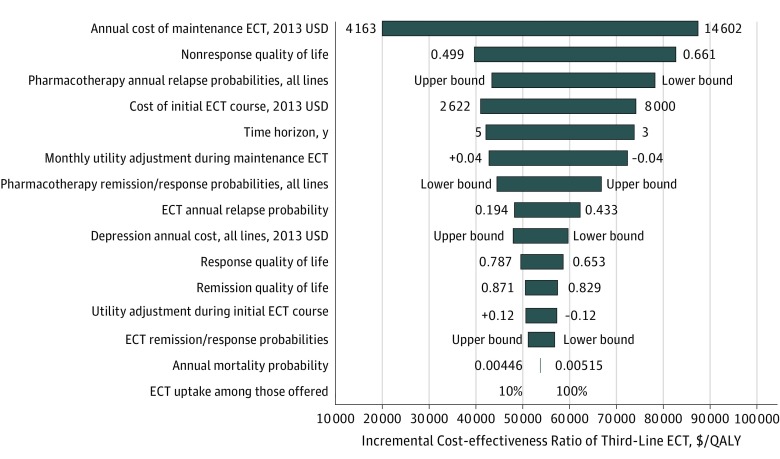
Figure 2. Univariate Sensitivity Analysis Results.
Horizontal bars indicate the range of incremental cost-effectiveness ratios (ICERs) for the third-line electroconvulsive therapy (ECT) strategy produced by varying the values of the model parameters shown on the vertical axis. The parameter values producing the lower value and upper value of the ICER are shown to the left and right of each horizontal bar. Values specified as lower bound or upper bound indicate that multiple model parameters are being varied in concert and cannot all be displayed on the figure; Table 1 provides parameter values. Parameters are arranged from those producing the greatest variation in the ICER (top) to those producing the least (bottom). QALY indicates quality-adjusted life-year.

