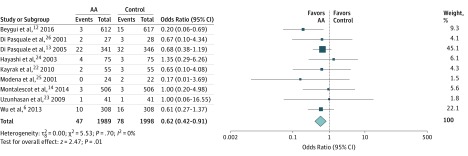
Figure 1. Mortality Comparing Aldosterone Antagonist (AA) Therapy vs Control.
Square data markers represent odds ratios; horizontal lines, the 95% CIs, with marker size reflecting the statistical weight of the study using random-effects meta-analysis. The diamond data marker represents the overall odds ratio and 95% CI for the outcome of interest. Evaluated using the random-effects Mantel-Haenszel test.

