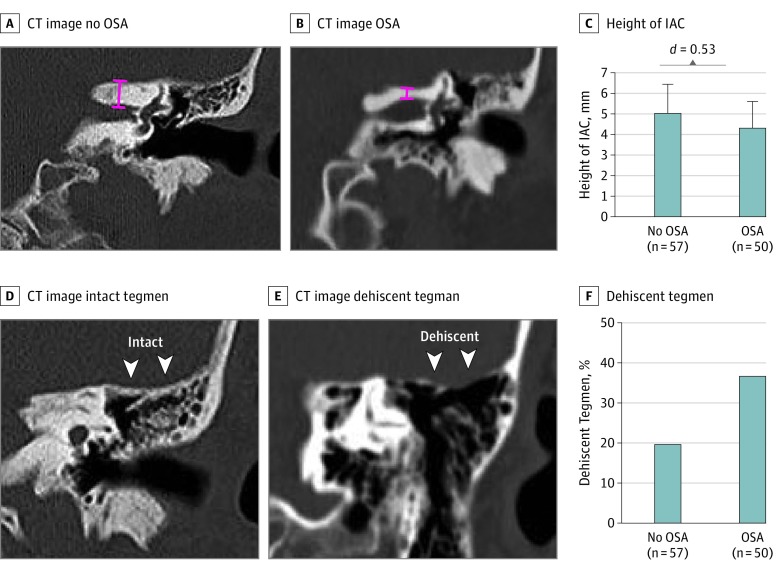
Figure 3. Skull Base Measurements in Non-OSA, OSA, and sCSF-L Patients.
Abbreviations: IAC, internal auditory canal; OSA, obstructive sleep apnea. A, Representative coronal computed tomographic (CT) image showing skull base (internal auditory canal) height measurement (red line) in a patient without OSA. B, Representative coronal CT showing skull base height measurement (red line) in a patient with OSA. C, Patients with OSA had significantly thinner skull base height compared with those without OSA. D, Representative coronal CT showing an intact tegmen mastoideum. E, Representative coronal CT showing a dehiscent tegmen mastoideum. F, Patients with OSA had nearly double the incidence of tegmen dehiscence compared with those who did not have OSA (37% vs 20%).

