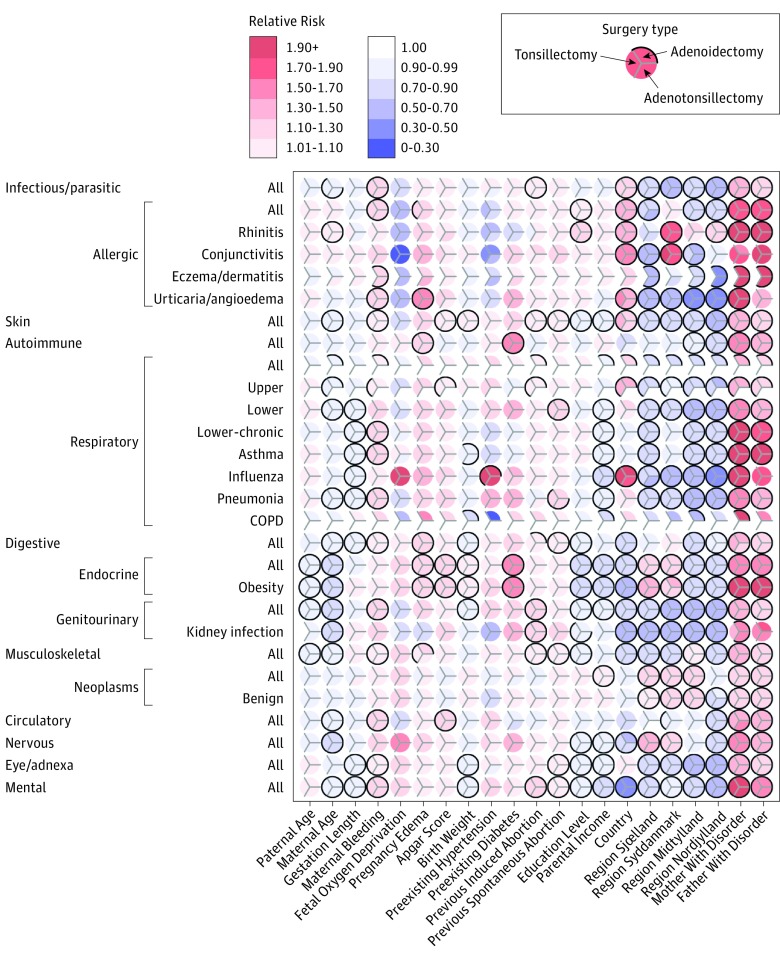
Figure 3. Disease Risk Patterns for Covariates.
Relative risk magnitude and direction correspond to red (increased relative risk) and purple (decreased relative risk) colors derived from Cox regressions capturing the risk of diseases (vertical axis) within the first 30 years of life depending on 21 covariates (horizontal axis). Within each circle there are 3 divisions corresponding to surgery type. A black border indicates whether risk for that particular disease-covariate combination was significant after Bonferroni correction for 78 tests; a complete black border surrounding a circle indicates that risks were significant for all 3 surgeries. Disease risks for the covariate region most lived in Denmark are relative to Hovedstaden (Copenhagen region). Note: Urinary tract infections were not included in the kidney infection group.

