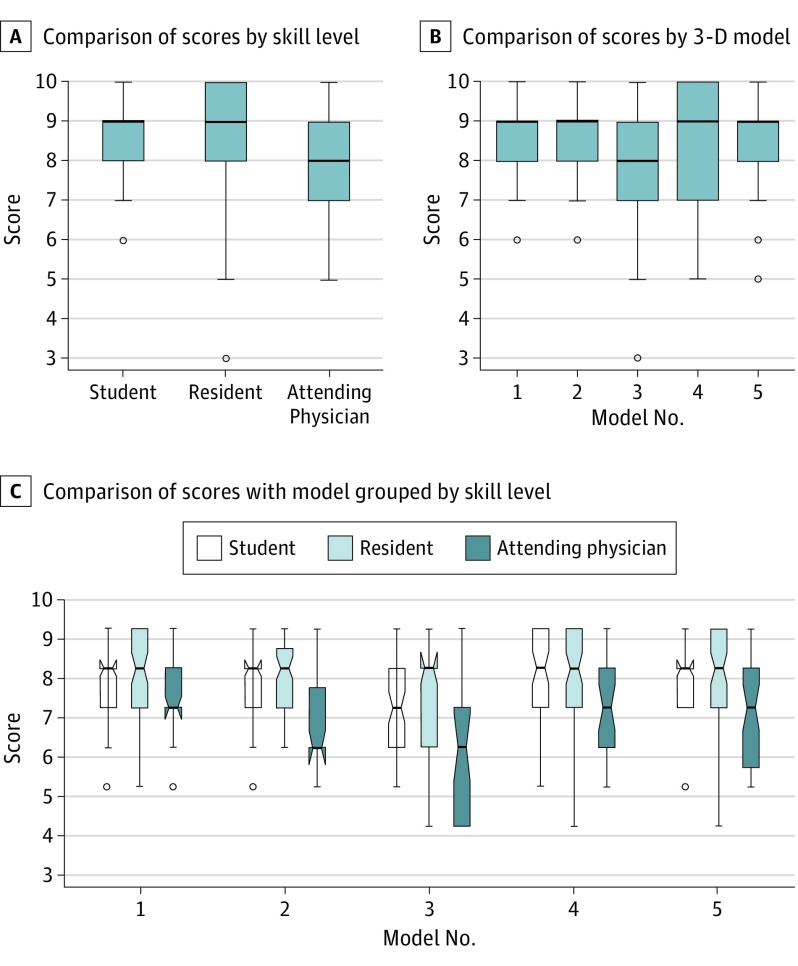
Figure 3. Results From Statistical Comparisons Using Box Plots.
A, Comparison of scores assigned by skill level. Analysis of variance demonstrated a statistically significant difference, with the attending physician group showing the lowest mean (SD) scores (7.71 [1.09]; F = 31.6; P < .001) compared with the 2 other groups. B, Comparison of scores by 3-dimensional (3-D) model did not show a significant difference (F = 1.5; P = .22). C, Similar comparison of score with model grouped by skill level of assessment (F = 2.23; P = .13). Effect size is provided in the text. In each comparison, the box plot indicates the 25th to 75th interquartile range within the box centered around the median and spread of data by the whiskers. Circles indicate outliers.

