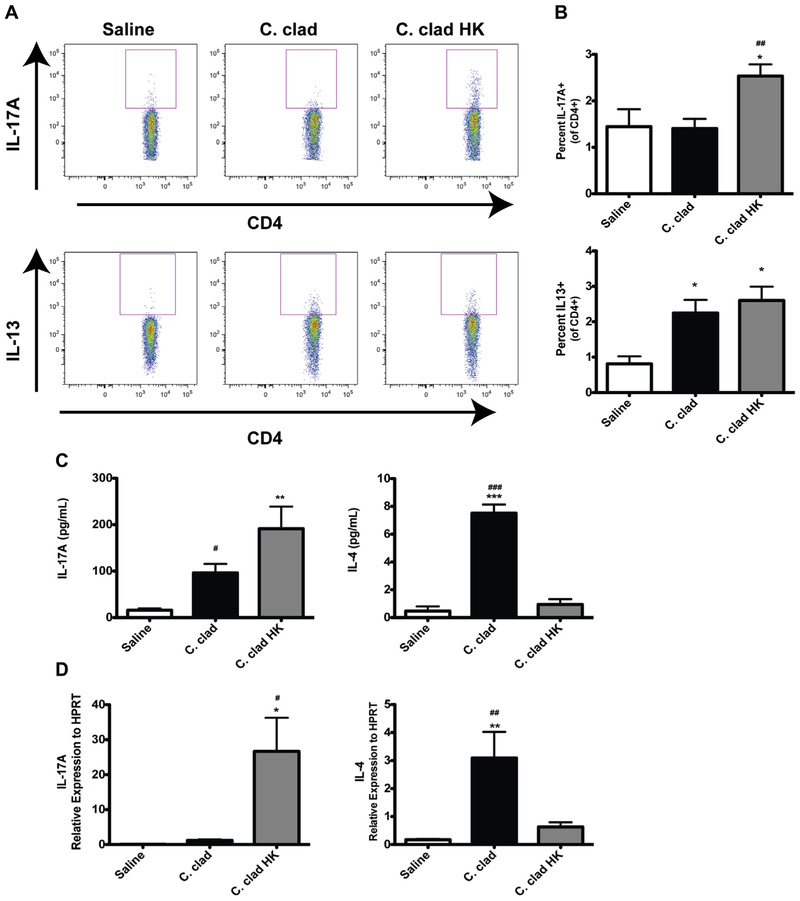
FIG 2.
Induction of a TH17 response by heat-killed C cladosporioides (C clad HK). Contour plots (A) and quantification of intracellular cytokine staining for IL-13 or IL-17A in CD4+ lung cells (B). C, Levels of IL-17A and IL-4 in BALF. D, Relative levels of mRNA for IL-17A and IL-4 in whole lung. Data are representative of 3 independent experiments and are expressed as mean and SEM. n = 4 to 6 mice per group. HPRT, Hypoxanthine phosphoribosyltransferase. *P < .05, **P < .01, and ***P < .001 as compared with saline. #P < .05, ##P < .01, and ###P < .001 as compared with C clad HK.

