
Figure 3.
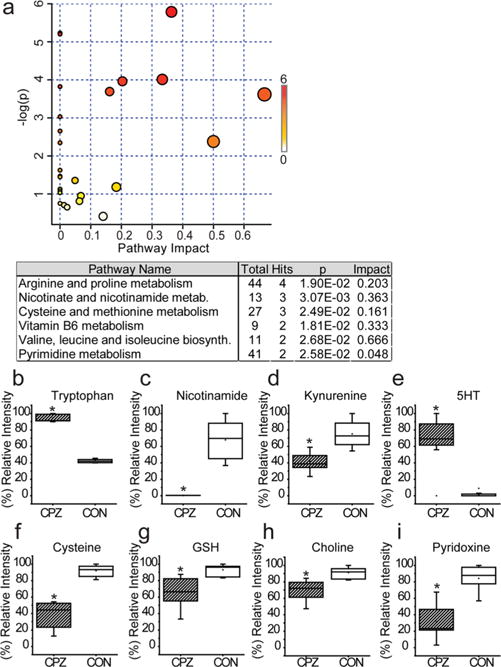
CPZ perturbs the metabolism of MO3.13 cells. (a) Pathway analysis of metabolic changes induced by CPZ treatment of MO3.13 cells as determined by MetaboAnalyst. The overview shows all matched pathways according to P values from pathway enrichment analysis and pathway impact values from pathway topology analysis (varying from yellow to red). The node color is based on the P value, and the node radius is determined on the basis of the pathway impact values. (b–i) Box and whisker plots of significant features (P < 0.05; t test; >2-fold change) identified with both parent ion and fragment ion information compared between the CPZ (n = 10) and control (CON) (n = 10) treated MO3.13 cells (*P < 0.001). 5-HT represents 5-hydroxytryptophan and GSH reduced glutathione.