
Figure 2.
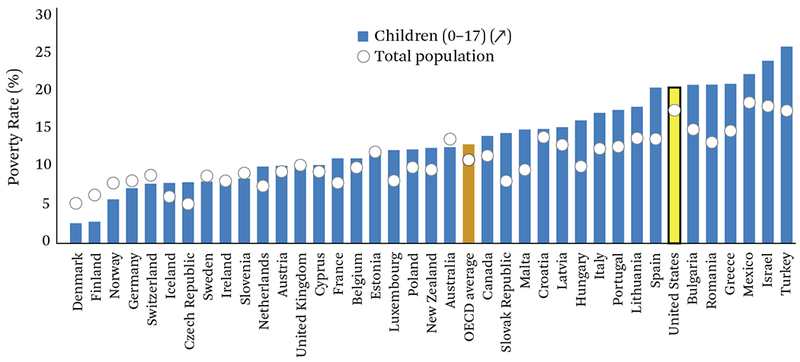
Child Income Poverty Rates, 2012
Source: Authors’ compilation based on OECD 2016.
Note: Percentage of children (0–17) that live in households with an equivalized post-tax and transfer income of less than 50 percent of the national annual median equivalized post-tax and transfer household income. Data for Canada refer to 2011.