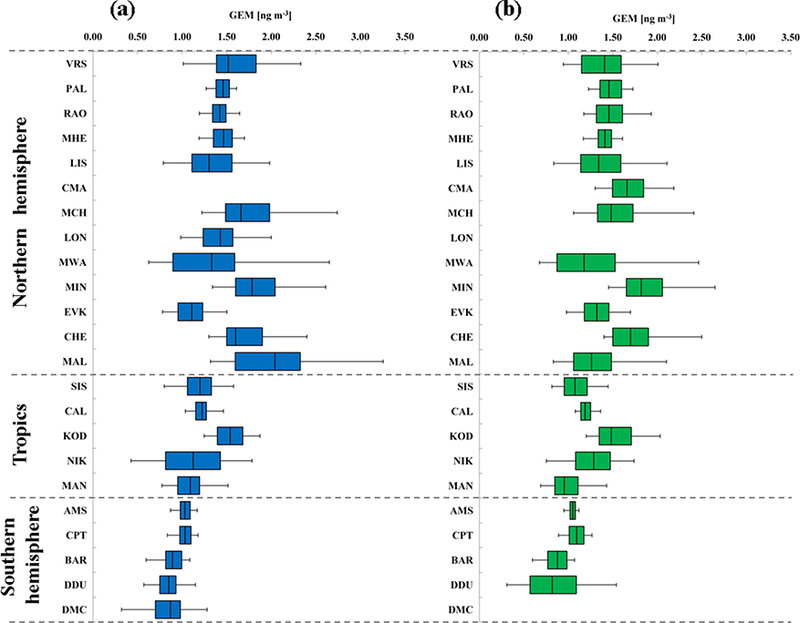
Figure 3.

Box-and-whisker plots of gaseous elemental mercury yearly distribution (GEM, ng m−3) at all GMOS stations for (a) 2013 and (b) 2014. The sites are organized according to their latitude from the northern to the southern locations. Each box includes the median (midline) and 25th and 75th percentiles (box edges), 5th and 95th percentiles (whiskers).
