Figure 4.

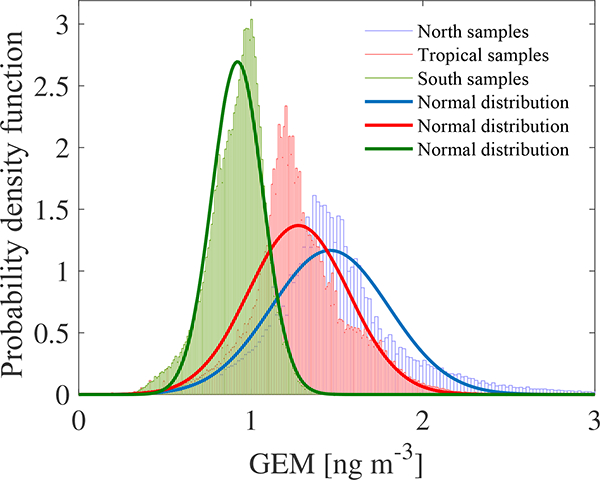
Probability density functions (PDFs) of the GEM data (ng m−3) for the northern, southern and tropical sample groups (dash dotted lines). Full lines the normal distribution fit of the samples.

Probability density functions (PDFs) of the GEM data (ng m−3) for the northern, southern and tropical sample groups (dash dotted lines). Full lines the normal distribution fit of the samples.