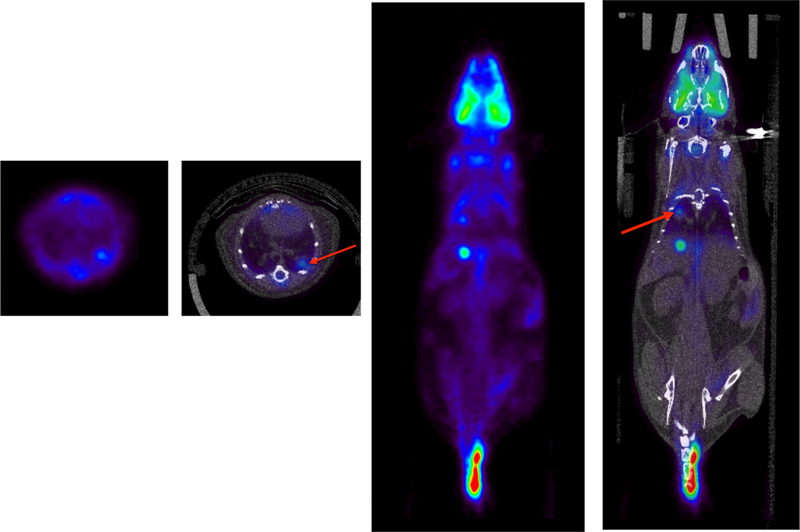
Fig. 9.

Whole-body PET-CT imaging of a mouse from a lung tumor model study. A single bed-position 15 min PET scan was acquired 1-hour post injection of 175 μCi of 18FDG. PET imaging was followed by a general-purpose CT acquisition. Shown above is a single transverse PET, and co-registered PET-CT slices (left), and corresponding coronal slice (right). The FDG avid areas are highlighted (red arrows) in the fused PET-CT images. Images courtesy of David Walter and Dr. David Feldser at U. Penn.
