
Figure 1: Abnormal accumulation of FAPs during muscle atrophy by acute denervation.
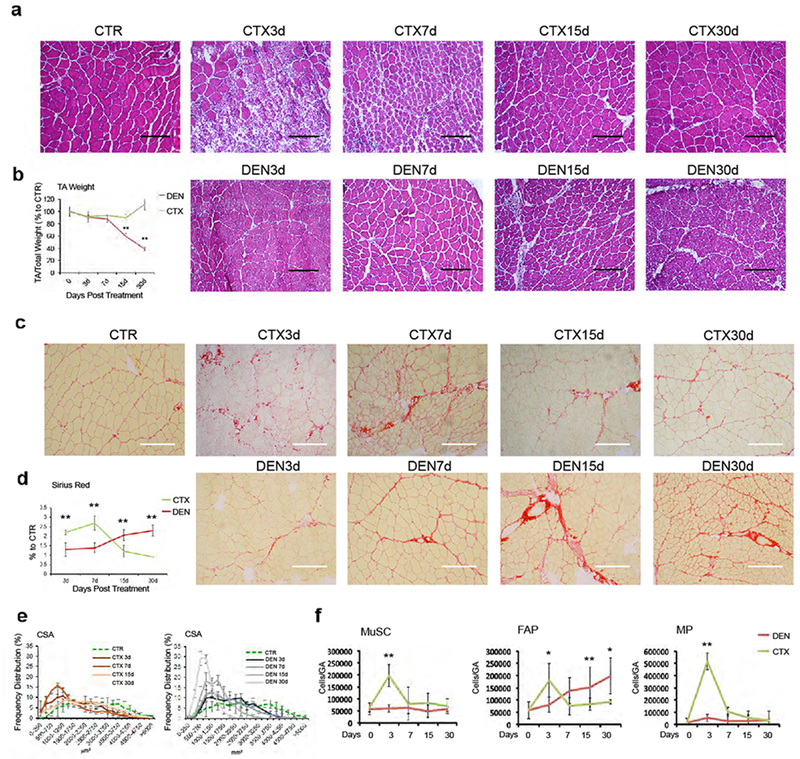
(a) Hematoxylin-Eosin staining of control (CTR), injured (CTX) or denervated (DEN) TA muscle cryosections at the indicated time points. Scale bar 200 μm. Data shown represent 3 independent experiments, (b) Quantification of normalized TA muscle weight. Values represent mean ± s.d. **P = 0.001; by one-way ANOVA (n=3 animals/group) (c) Representative images of Sirius red staining of control (CTR), injured (CTX) and denervated (DEN) TA muscle cryosection. Scale bar 200 μm. Data shown represent 3 independent experiments) (d) Quantification of collagen staining shown in c. Values represent mean ± s.d. **P < 0.01; by one-way ANOVA (n=3 animals/group), (e) Frequency distribution of fiber Cross-Sectional Area (CSA) in injured (CTX) (left panel) and denervated (DEN) (right panel) TA muscles. Values represent mean ± s.d. (n=3 animals/group), (f) Cyto-fluorimetric analysis of indicated cell types in injured (CTX) or denervated (DEN) muscles at the indicated time points. Values represent mean ± s.d. **P < 0.01, *P<0.05; by one-way ANOVA (n=12 CTR, n=20 DEN15d, n=6 DEN3d, CTX7d, n=4 CTX3d, CTX15d, n=3 DEN7d, DEN30d, CTX30d; “n” refers to animal numbers).