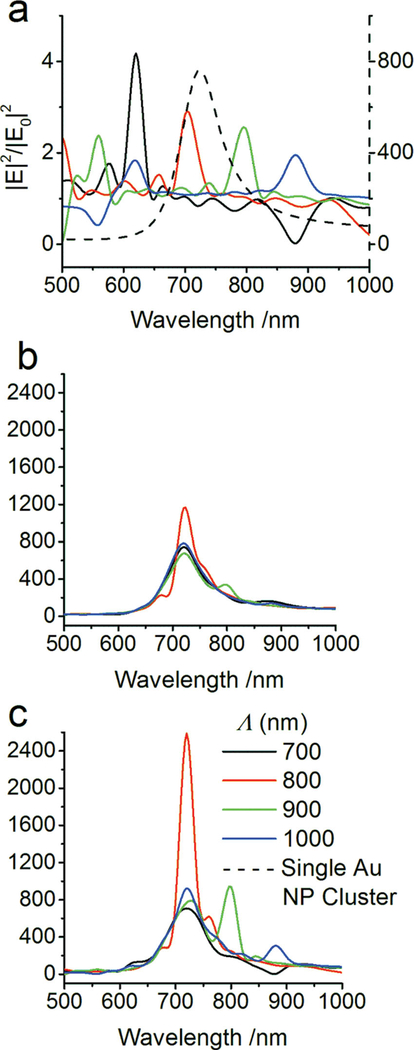
Figure 5.
M STM-simulated E-field intensity enhancement spectra at the hottest electromagnetic spot in a) an array of 20×20 TiO2 NPs; b) a 20 × 20 Au NCA; and c) the combined optoplasmonic array for different Λ values. The near-field intensity spectrum for an individual NP trimer is included in (a) for comparison. Please note the different E-field intensity scales in (a). The E-field intensities of the photonic modes (solid lines) are plotted to the left scale; the E-field intensity of the NP cluster (dashed line) is plotted to the right scale.

