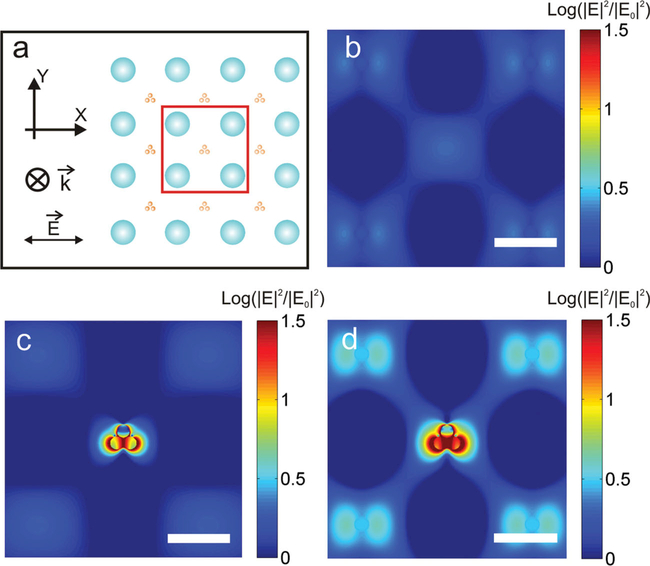
Figure 6.
a) Simulation geometry for the optoplasmonic array. Although only the center area (red box, Au NP plane) is plotted in the near-field map, the whole array is considered in the simulations. Near-field intensity enhancement, |E|2/|E0|2, maps for b) an array of 20×20 TiO2 NPs, c) a 20×20 Au NCA, and d) the corresponding optoplasmonic array at λ = 720 nm. The combination of metallic and dielectric NPs in (d) boosts the near-field intensity not only in the hot-spots defined by the NP clusters but also at locations in the array that are not in the direct vicinity of a NP cluster. All scale bars are 500 nm.

