

Abstract
We developed a high-speed, swept source OCT system for widefield OCT angiography (OCTA) imaging. The system has an extended axial imaging range of 6.6 mm. An electrical lens is used for fast, automatic focusing. The recently developed split-spectrum amplitude and phase-gradient angiography allow high-resolution OCTA imaging with only two B-scan repetitions. An improved post-processing algorithm effectively removed trigger jitter artifacts and reduced noise in the flow signal. We demonstrated high contrast 3mm×3mm OCTA image with 400×400 pixels acquired in 3 seconds and high-definition 8mm×6mm and 12mm×6mm OCTA images with 850×400 pixels obtained in 4 seconds. A widefield 8mm×11mm OCTA image is produced by montaging two 8mm×6mm scans. An ultra-widefield (with a maximum of 22 mm along both vertical and horizontal directions) capillary-resolution OCTA image is obtained by montaging six 12mm×6mm scans.
Keywords: Optical coherence tomography, optical coherence tomography angiography, widefield imaging
Graphical Abstract
We develope a high-speed, swept source OCT system for widefield OCT angiography (OCTA) imaging. The system has dedicated feature for widefield OCTA imaging. These features include an extended axial imaging range, a fast automatic focusing mechanism, an effective trigger-jitter correction technique and an efficient OCTA algorithm. An ultra-widefield capillary-resolution OCTA image is demonstrated.
1. Introduction
Fluorescence angiography (FA) and indocyanine green angiography (ICGA) remain the gold standards for the imaging of vascular abnormalities in the retina and choroid. However, both FA and ICGA are invasive techniques because they require the injection of dyes, and the application of FA and ICGA have been limited due to the relatively long measurement time and patient discomfort. Optical coherence tomography (OCT) has become a standard-of-care imaging modality in ophthalmology. OCT angiography (OCTA) is a functional extension of OCT and is capable of noninvasively imaging the retinal and choroidal vasculature [1–6]. Because of recent commercialization of the OCTA technique, the applications in clinical diagnosis have increased dramatically [7]. However, the widespread clinical usage of OCTA is still dependent on overcoming challenges such as the limited field of view (FOV) and motion artifact correction [8]. A few hardware and software based methods have been proposed to correct the motion artifacts and some of them have been commercially available [8–11].
To acquire a larger field of view, a higher speed system is necessary. High-speed imaging has been demonstrated for both spectral-domain (SD) OCT and swept source (SS) OCT systems. By stitching multiple small 3D scans with a montage scanning protocol, widefield high-resolution OCTA images have been produced by several groups [8, 12, 13]. The single small 3D scans demonstrated in these studies had a field of view of less than 3×3 mm, and between 9 and 42 small 3D scans were used to generate the widefield OCTA [14]. Too many scans increase the total imaging time and make successful imaging difficult to accomplish in typical clinical situations. With the recent advance of high speed OCT systems, a single scan covering a relatively large area have been demonstrated by several groups. By using an ultrahigh speed FDML laser of 1.68 MHz, Blatter et al. demonstrated a widefield angiography with a field of view of ∼48 degrees that was acquired in a total acquisition time of 7 seconds [15]. However, the small retinal capillaries were only weakly visible on the angiography images. Recently, a widefield 12mm×12mm OCTA with 500×500 pixels was demonstrated by a 100 kHz swept source OCTA system for quick qualitative assessment of a diseased eye so that regions of interest can be identified for a further detailed investigation if necessary [16]. A very recent paper by Polans et al. demonstrated a widefield OCTA with a field of view of 70 degrees that was acquired in a single scan in 21.6 seconds [17]. However, a 21.6 s acquisition time is not amenable to real clinical practice.
The high scan rate of SD-OCT is achieved by use of a high-speed line scan camera. The typical charged-coupled device (CCD) camera used for an 840-nm SD-OCT system has a speed of 20~70 kHz. A higher speed line scan CCD camera is also available with reduced elements in the array, which results in a reduced axial imaging depth. Swept source OCT (SS-OCT) has the benefit of not requiring a spectrometer or line scan camera. The scan rate in SS-OCT is determined by the sweep repetition rate of the light source and can be much faster than SD-OCT. The development of new swept laser technology known as Fourier domain mode locking (FDML) enabled dramatic increases in laser sweep rates [18, 19] and recent demonstrations of retinal imaging using research SS-OCT systems have achieved an A-scan rate of several MHz [20]. More recently, compact vertical cavity surface emitting lasers (VCSEL) have been developed that enable both long range and high-speed SS-OCT [21].
In this manuscript, we investigate high contrast, high resolution, widefield OCTA imaging with a custom-developed 200-kHz SS-OCT system. Although a faster swept-laser is commercially available, there is a tradeoff between the speed of OCT systems and sensitivity. The sensitivity of OCT is limited by the maximum permissible incident power on the eye set by the American National Standards Institute (ANSI) [22]. In addition to the hardware, software development is important for OCTA applications. A highly efficient OCT algorithm will not only increase the signal-to-noise ratio but also shorten the imaging time by reducing the number of necessary B-scan repetitions. We use a highly efficient split-spectrum amplitude and phase gradient algorithm (SSAPGA) [23] that allows high-resolution OCTA derived from only two B-scan repetitions. In the current study, we introduced an improved trigger jitter artifact (TJA) correction method and produced high contrast 3mm×3mm OCTAs captured in 3 seconds, and high-resolution 8mm×6mm and 12mm×6mm OCTAs obtained in 4 seconds. Thus, by stitching six 12mm×6mm scans, we demonstrated an ultra-widefield capillary-resolution OCTA with a maximum of 22 mm along both vertical and horizontal directions.
2. Materials and Methods
2.1. System setup
Figure 1 shows the schematic of the widefield SS-OCT system. The commercially available swept laser (Axsun 1060, Axsun Technologies, Billerica, MA, USA) had a sweep rate of 200 kHz, a center wavelength of 1044 nm, and a tuning range of 104 nm. The light from the laser was split into the sample and reference arms with a 90:10 fiber optic coupler (AC Photonics, Santa Clara, CA, USA). In the reference arm, a commercially available fiber optic delay line (Biomedical Optics LLC, Irvine, CA, USA) was used to tune the reference arm path length, and an iris diaphragm controlled the light intensity. In the sample arm, the light was first collimated with a collimator (F280APC-1064, Thorlabs Inc, Newton, New Jersey, USA) and then passed through an electrically tunable lens (EL-6–18, Optotune AG, Dietikon, Switzerland). The light was then scanned by a two-axis galvanometer mirror scanner (6200H, Cambridge Technology, Bedford, MA USA). The scanned light beam then passed through a telescope and finally shined on the cornea. The telescope includes two groups of two 2” diameter achromatic doublets. The first group has two achromatic doublets with a focal length of 150 mm (two AC508–150-B, Thorlabs Inc, Newton, New Jersey, USA), resulting in an effective focal length of ~75 mm. The second group has two achromatic doublets with a focal length of 75 mm (AC508–075-B, Thorlabs Inc, Newton, New Jersey, USA), resulting in an effective focal length of ~37.5 mm. The measured power on the cornea was 1.8 mW, consistent with safe ocular exposure limits set by ANSI. The measured system sensitivity was 96 dB at close to the zero-delay location. The sensitivity decrease along the whole axial imaging range is 6.9 dB. The sample arm contained a standard slit-lamp base that was adapted with the custom OCT scanning optics. Two red light emitting diodes (LEDs) were employed to illuminate the iris for beam alignment with an iris camera. A mini-projector (P3, AAXA Technologies, Inc., Tustin, CA, USA) was used for a fixation target. A dichroic mirror (DMSP805L, Thorlabs Inc, Thorlabs Inc, Newton, New Jersey, USA) was used to couple the fixation target light and OCT light.
Figure 1.

Schematic of widefield swept source OCT system.
2.2. Extended axial imaging range
The 200-kHz swept laser had a built-in clock signal with a frequency range of 347.5 MHz to 517.6 MHz. By using the built-in clock signal, the axial imaging depth range of the OCT system was approximately 3.3 mm. For widefield OCT imaging, this range was insufficient due to the curvature of the retina [24]. To avoid curvature-dependent image cropping, an extended axial imaging range was necessary. Extending the axial depth imaging range by doubling the clock frequency is a simple and cost effective method [25, 26] that we adopted. The clock from the laser was first filtered by a high-pass filter (SHP 300+, Mini-Circuits, Brooklyn, NY,USA) and then a low-pass filter (SLP-550+, Mini-Circuits, Brooklyn, NY,USA). The signal was amplified by a low-noise amplifier (ZRL-700+, Mini-Circuits, Brooklyn, NY,USA). A frequency multiplier (MK-5, Mini-Circuits, Brooklyn, NY,USA) was used to double the frequency of the filtered signal. The amplified signal was then filtered again (SHP-700+,SLP-1200+, Mini-Circuits, Brooklyn, NY,USA) by high- and low-pass filters. The clock signal was amplified again (ZRL-1150LN+, Mini-Circuits, Brooklyn, NY,USA) before sending it to the digitizer. The extended axial imaging range was ~6.6 mm. Figure 2 shows three OCT retinal images taken at axial depth location of ~ 1.5 mm, 3.2 mm, and 4.5 mm, respectively. As can be seen in the figure, the system demonstrated good sensitivity along the entire axial imaging range.
Figure 2.

Extended axial imaging range allowed easy alignment and avoided imaging cropping due to retinal curvature. A-C are retinal images take at axial locations of ~1.5 mm, 3.2 mm, and 4.5 mm, respectively. The images have a field of view of 10 (horizontal )×6.6 (vertical) mm.
2.3. Automatic focus with the electrically tunable lens
Automatic focusing is important for in vivo high-quality OCT imaging. Commercial OCT systems usually are equipped with an automatic focusing mechanism to find the optimal focus plane for imaging. Mechanical methods that change the axial location of the optical imaging lens are used to change the focal plane, a process that is usually slow. Recently, electrically tunable lenses have been used for focal plane optimization and dynamic focus in OCT. [26, 27] Here, we used an electrically tunable lens to optimize the focus plane automatically. Based on a combination of optical fluid and a polymer membrane, the shape of the lenses and thus the focal length can be changed by modifying the controlling current. The tunable range of the electrical lens is 35 diopters (−8 diopters to 27 diopters) and the response time is 5 milliseconds. The fast response time allows rapid automatic focusing. By properly adjusting the distance between the two lenses in the telescope, the whole system used in this study realized a tunable focus range of −17.5 diopters to 17.5 diopters.
The control current of the tunable lens can be adjusted from the control panel of the OCT data acquisition software. We achieved automatic focusing by searching for the optimized control current that maximized the overall image intensity in the 2D preview mode. A two-stage search protocol was used. In the first stage, the control current of the tunable lens was changed from 60 mA to 160 mA in steps of 5 mA. The corresponding range of diopter change was from −10 to +10 diopters. At every step, an OCT B-scan image was acquired, and the number of pixels that had an intensity value of more than a threshold value was calculated. The threshold value (IT ) was determined based on the OCT image without any sample or could be determined from vitreous region in a retina image. The threshold value (IT) was calculated from the sum of the mean intensity value (Im ) and the three times of standard deviation value () in the region, namely, IT= Im+3. The current (Imax) that gave the maximum number of pixels was selected. In the second stage, the control current was tuned again from an Imax of −5 mA to +5 mA with a step size of 0.5 mA. The final control current was selected based on the current that gave the maximum number of pixels. The automatic focusing procedure took less than 0.4 seconds and had an accuracy of less than 0.1 diopters.
2.4. Data processing
2.4.1. OCT angiography algorithm
The recently developed SSAPGA was used to process the data and construct the angiography images [23]. The phase gradient method used the phase of the OCT complex signal to generate flow contrast. This approach did not suffer from the bulk phase artifacts induced by involuntary patient movement, and it minimized the TJA induced by phase instability in the SS-OCT system [23]. The SSAPGA combined the phase gradient contrast with OCT amplitude to calculate the OCTA flow and enhance the flow contrast. This method has improved the signal to noise ratio and achieved better contrast than split-spectrum amplitude-decorrelation angiography [23]. Figure 3 shows the flow chart for the processing. The detailed data processing steps are as follow: (1) Splitting the spectrum by multiplying the acquired interferogram by a Gaussian window (Fig. 3A). (2) Applying the numerical dispersion compensation and fast Fourier transform (FFT) for each band to get the complex OCT signal (Fig. 3B). (3) The phase terms of the complex OCT signal from the corresponding bands in the different fringes (obtained from repeated scans the same B-scan locations) are extracted, and the phase difference is calculated (Fig. 3B). (4) Determining the gradient of the phase difference (Fig. 3B). (5) Calculating the decorrelation by combining the phase gradient and amplitude (Fig. 3B). (6) Averaging the decorrelation values from 11 split spectrum bands (Fig. 3A).
Figure. 3.

Flow chart to calculate the split-spectrum amplitude and phase gradient algorithm (SSAPGA). The acquired interference fringes are split into 11 bands (3A). Each band was then processed with typical Fourier domain processing procedures (numerical dispersion, Fast Fourier transform) to get the complex OCT signals (3B). The phase difference and gradient of the difference in corresponding bands are calculated (3B). The amplitude and phase gradient angiogram (APGA) is obtained (3B) and the APGAs from different bands are averaged to get the final SSAPGA (3A).
2.4.2. Optical coherence tomography angiography trigger jitter artifact correction
The swept laser used in this study was limited by TJA. TJA manifests itself by the presence of fixed pattern noise that appears as horizontal lines in the OCT structural images. The effect of TJA on OCT structure and Doppler OCT have been investigated by several groups [28–31]. In this study, we will investigate the effect of TJA on the OCTA.
Postprocessing reduced the TJA by introducing a wavenumber shift (k-shift) in the interferograms of interest and by searching for the k-shift that minimized the fixed-pattern noise amplitude [32]. Here, an optimized version of the method was used to increase the processing speed. In our previous method, the reference interferogram was randomly chosen from the acquired background interferograms. By randomly choosing the reference interferogram, as shown in Fig. 4, the relative wavenumber shift points could be large, and most of the shift points were negative. In the case illustrated in Fig. 4, the median value for all k-shift points was around −25. To improve this, we carefully chose the reference interferogram so that the median value for all shift points was around zero. As shown in Fig. 4, we found one interferogram that had a k-shift point equal to the median value of all k-shift points. This A-line was taken as a reference interferogram and then used to process the data. By using the new reference interferogram, the k-shift points had smaller absolute values, and the median value for all the k-shift points was close to zero. Because the search range was reduced, the processing time was also reduced. To further reduce the processing time, k-shifts (from −40 to +40) were performed on the reference interferogram instead of the A-line of interest. This step dramatically improved the processing speed (by more than 35 times) because finding the correct wavenumber shift required only two FFTs for each A-line of interest. The improved method was suitable for real-time processing during data acquisition.
Figure 4.

Choosing of the reference interferogram for trigger jitter by a wavenumber shifting method. The figure shows the number of wavenumber shift points for all the A-lines in a B-scan using a randomly chosen reference interferogram (the reference A-line has a shift of 0 as shown by the red line in the figure). Based on the results, an A-line that has a wavenumber shift equaled to the median shift point (a shift number of −25 in this case, yellow dash line in the figure) was chosen as the new reference interferogram.
Figs. 5A and 5B show the cross-sectional OCT intensity and OCTA images of a human retina without TJA correction. TJAs were evident as bright horizontal lines (Fig. 5A, red arrows) and dim horizontal lines (Fig. 5A, yellow arrows). In the corresponding OCTA image (Fig. 5B), the bright and dim lines showed different features. At the bright line locations seen in Fig. 5A, there were no OCTA signals. However, at the dim line locations of Fig. 5A, there were OCTA noise signals. After TJA correction (Figs. 5C and 5D), these artifacts were no longer present. When the horizontal lines overlie the retina, this artifact can introduce misleading OCTA results for inexperienced investigators and clinicians in this field. Figs. 6A and 6B show another pair of cross-sectional OCT intensity and OCTA images without TJA correction. In Fig. 6A, the bright line overlies the retina. In the OCTA image (Fig. 6B), there was little or no OCTA signal at the bright line location. The proposed method can effectively correct the TJA and improve the image for both OCT intensity (Fig. 6C) and OCTA (Fig. 6D) images.
Figure 5.

TJA introduces noise on both the OCT intensity and OCTA images. Cross-sectional OCT intensity (A) and angiographic (B) images without TJA correction. Cross-sectional OCT intensity (C) and OCTA (D) images with TJA correction. The trigger jitter not only adds fixed pattern noise on the OCT intensity images, but it also introduces noise on the OCTA image.
Figure 6.

TJA correction improves the image quality of both OCT intensity and OCTA images. Cross-sectional OCT intensity (A) and OCTA (B) images without TJA correction. Cross-sectional OCT intensity (C) and OCTA (D) images with TJA corrected. At the bright horizontal line indicated by the red arrow (A), the OCTA image (B) showed little or no flow signal in OCTA image. After TJA correction, both the OCT intensity (C) and OCTA (D) images show improved quality.
2.4.3. High contrast, high resolution, and widefield OCTA
The fast system would allow widefield OCTA imaging in a single scan. It could also achieve high-density scans in a smaller area to provide high contrast OCTA. Undersampling reduces image contrast [33], and we have shown that the OCTA flow signal increases with the increase of sampling density and that the best contrast is obtained at a smaller field of view. [34] The typical human retinal OCT system has a lateral resolution of around 15 μm. To get the best contrast image, the ideal sampling step should be less than around 7.5 μm. Figure 7 shows a high contrast 3mm×3mm OCTA image captured with our system. The image contains 400×400 pixels, and the sampling step size was 7.5 μm. The imaging time for a single scan was around 3 seconds. The capillaries are clearly visible.
Figure 7.

High contrast, high-resolution 3mm×3mm OCTA image of the optic disk.
Where high contrast is not needed, the current system could provide high-resolution widefield OCTA images by reducing the sampling density. Figure 8 shows a widefield 8×11-mm OCTA image. This image is a montage of two scans centered at the fovea and the disk center. Each scan contained 800 B-frames with 850 A-lines pre-B-frames. A single en face image has 850 (vertical)×400 (horizontal) pixels on an 8 mm (vertical)×6 mm (horizontal) area. The sampling step size was 10 μm and 15 μm, respectively, for the vertical and horizontal directions. The whole data acquisition for a single scan was completed in 4 seconds. Although the contrast of the widefield OCTA is not as good as the one shown in the Fig. 7, the capillaries are clearly visible in the image.
Figure 8.

High-resolution widefield retina OCTA with a field of view of 8 mm ×11 mm for scanning glaucoma patient by montaging of 2 scans.
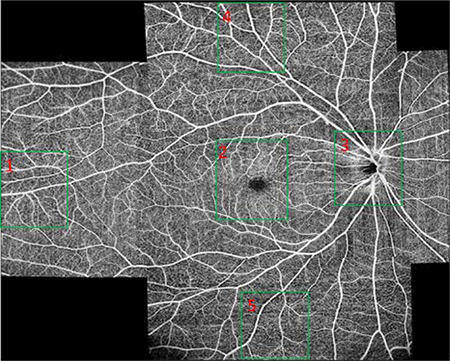
Further increasing the field of view of a single scan can be achieved with an even larger sampling step size. With a 15 μm sampling step size for both the vertical and horizontal directions, a high-resolution OCTA image can still be achieved. Figures 9A, 9B and 9C show the ultra-widefield OCTA images of the retina, choroidal capillaries and choroid covering an area with maximum 22 mm along both vertical and horizontal directions. The images are montage of 6 scans. Each scan has a field of view of 12mm×6 mm, containing 850×400 pixels. The imaging time for each scan was 4 seconds. Figure 10 shows the enlarged images corresponding to the regions in the green boxes in Fig. 9A. The capillaries can still be seen in the images. The total imaging time (including alignment) for all six of the scans is 15 – 25 minutes if the system is operated by an experienced operator. This time is acceptable in most clinical situations.
Figure 9.

Ultra-widefield (22mm×22 mm) OCTA of the retinal (A), choroidal capillaries (B) and choroidal (C) circulation using a montage of six 12×6-mm scans of 850×400 pixels. The scan location was controlled by moving the fixation target with a pico-projector. The regions indicated by the five green boxes in (A) are enlarged and shown in Fig. 10.
Figure 10.

Magnified images of the five regions in the blue boxes in Fig. 9. (A)~ (E) are corresponding magnified images in regions (1) ~ (5) in Fig. 9. The capillaries are visible in all images.
3. Discussions.
The scan protocols that we use were designed based on our system setting. Firstly, the sensitivity of the OCTA system must be high enough to detect the capillaries. This requires a longer enough time interval between adjacent repeated B-scans and enough number of repetitions at the same B-scan location. We found that the optimum time interval was 5 ms when only two B-scan at the same location was used [34, 35]. So in this study, we set the B-scan time interval to 5 ms for widefield imaging to keep the sensitivity. The time interval corresponds to 1000 A-lines per B-scan. Another limitation was from the beam scanner, which cannot scan very fast. The typical non-resonant scanner works at a frequency of less than 400 Hz (for large scanning angle, the maximum working frequency is even lower) and for a fast system, we have to use more A-scans in a B-scan to reduce the load of the scanner. So for wide field OCTA, out protocol images a rectangle area instead of square area.
Currently, the total imaging time for the wide-field 6 scans is around 15–25 minutes. However, each scan only takes 4 seconds. The other time was spent for adjusting the fixation target, re-alignment and data saving. The patients are only required to keep their eye stable during the 4 -second scans. The total imaging time could be shortened further by optimizing the operation software, increasing the computer memory and automating the whole process. We are conducting clinic studies with the current system and we have imaged more than 30 patients with the system, up to now.
4. Conclusions
We developed a widefield OCTA system with a commercially available 200-kHz swept source laser. The new system successfully acquired high-resolution widefield angiographic images of the human retina. In single scans of 4 seconds or less, it produced high contrast images of the retinal vasculature with a small (3mm×3mm) field of view or high-resolution vasculature images with a large (8mm×6 mm or 12mm×6 mm) field of view. Widefield 8mm×11mm OCTA image was constructed by montaging two 8mm×6mm single scans. We also constructed ultra-widefield (with maximum 22 mm along both vertical and horizontal directions) OCTA images by montaging six 12mm×6mm scans.
Acknowledgments
Funding
Oregon Health & Science Foundation, National Institutes of Health Grants DP3 DK104397, R01 EY024544, R01 EY023285 and R01 EY018184, unrestricted departmental funding from Research to Prevent Blindness (New York, NY, USA), and P30 EY010572 from the National Institutes of Health (Bethesda, MD, USA).
Footnotes
Financial Disclosures
Drs. Yali Jia and David Huang have a significant financial interest in Optovue, Inc., a company that may have a commercial interest in the results of this research and technology. Dr. David Huang also has a financial interest in Carl Zeiss Meditec, Inc. These potential conflicts of interest have been reviewed and managed by OHSU. No other authors have a financial interest in this article.
References
- 1.Jia Y, Tan O, Tokayer J, Potsaid B, Wang Y, Liu JJ, Kraus MF, Subhash H, Fujimoto JG, Hornegger J, and Huang D, “Split-spectrum amplitude-decorrelation angiography with optical coherence tomography,” Opt. Express 20, 4710–4725 (2012). [DOI] [PMC free article] [PubMed] [Google Scholar]
- 2.Liu G, Jia W, Nelson JS, and Chen Z, “In vivo, high-resolution, three-dimensional imaging of port wine stain microvasculature in human skin,” Lasers Surg Med 45, 628–632 (2013). [DOI] [PMC free article] [PubMed] [Google Scholar]
- 3.An L and Wang RK, “In vivo volumetric imaging of vascular perfusion within human retina and choroids with optical micro-angiography,” Opt Express 16, 11438–11452 (2008). [DOI] [PubMed] [Google Scholar]
- 4.Makita S, Hong Y, Yamanari M, Yatagai T, and Yasuno Y, “Optical coherence angiography,” Opt Express 14, 7821–7840 (2006). [DOI] [PubMed] [Google Scholar]
- 5.Gao SS, Liu G, Huang D, and Jia Y, “Optimization of the split-spectrum amplitude-decorrelation angiography algorithm on a spectral optical coherence tomography system,” Opt. Lett . 40, 2305–2308 (2015). [DOI] [PMC free article] [PubMed] [Google Scholar]
- 6.Zhao Y, Chen Z, Ding Z, Ren H, and Nelson JS, “Three-dimensional reconstruction of in vivo blood vessels in human skin using phase-resolved optical Doppler tomography,” IEEE J. of Selected Topics in Quantum Electronics 7, 931–935 (2001). [Google Scholar]
- 7.Jia Y, Bailey ST, Hwang TS, McClintic SM, Gao SS, Pennesi ME, Flaxel CJ, Lauer AK, Wilson DJ, Hornegger J, Fujimoto JG, and Huang D, “Quantitative optical coherence tomography angiography of vascular abnormalities in the living human eye,” Proceedings of the National Academy of Sciences 112, E2395–E2402 (2015). [DOI] [PMC free article] [PubMed] [Google Scholar]
- 8.Zhang Q, Huang Y, Zhang T, Kubach S, An L, Laron M, Sharma U, and Wang RK, “Wide-field imaging of retinal vasculature using optical coherence tomography-based microangiography provided by motion tracking,” BIOMEDO 20, 066008–066008 (2015). [DOI] [PMC free article] [PubMed] [Google Scholar]
- 9.Zang P, Liu G, Zhang M, Dongye C, Wang J, Pechauer AD, Hwang TS, Wilson DJ, Huang D, Li D, and Jia Y, “Automated motion correction using parallel-strip registration for wide-field en face OCT angiogram,” Biomed. Opt. Express 7, 2823–2836 (2016). [DOI] [PMC free article] [PubMed] [Google Scholar]
- 10.Kraus MF, Potsaid B, Mayer MA, Bock R, Baumann B, Liu JJ, Hornegger J, and Fujimoto JG, “Motion correction in optical coherence tomography volumes on a per A-scan basis using orthogonal scan patterns,” Biomed. Opt. Express 3, 1182–1199 (2012). [DOI] [PMC free article] [PubMed] [Google Scholar]
- 11.Hendargo HC, Estrada R, Chiu SJ, Tomasi C, Farsiu S, and Izatt JA, “Automated non-rigid registration and mosaicing for robust imaging of distinct retinal capillary beds using speckle variance optical coherence tomography,” Biomed. Opt. Express 4, 803–821 (2013). [DOI] [PMC free article] [PubMed] [Google Scholar]
- 12.Kim DY, Fingler J, Werner JS, Schwartz DM, Fraser SE, and Zawadzki RJ, “In vivo volumetric imaging of human retinal circulation with phase-variance optical coherence tomography,” Biomed Opt Express 2, 1504–1513 (2011). [DOI] [PMC free article] [PubMed] [Google Scholar]
- 13.Choi W, Mohler KJ, Potsaid B, Lu CD, Liu JJ, Jayaraman V, Cable AE, Duker JS, Huber R, and Fujimoto JG, “Choriocapillaris and Choroidal Microvasculature Imaging with Ultrahigh Speed OCT Angiography,” PLoS ONE 8, e81499 (2013). [DOI] [PMC free article] [PubMed] [Google Scholar]
- 14.Zhang Q, Lee CS, Chao J, Chen C-L, Zhang T, Sharma U, Zhang A, Liu J, Rezaei K, Pepple KL, Munsen R, Kinyoun J, Johnstone M, Van Gelder RN, and Wang RK, “Wide-field optical coherence tomography based microangiography for retinal imaging,” Scientific Reports 6, 22017 (2016). [DOI] [PMC free article] [PubMed] [Google Scholar]
- 15.Blatter C, Klein T, Grajciar B, Schmoll T, Wieser W, Andre R, Huber R, and Leitgeb RA, “Ultrahigh-speed non-invasive widefield angiography,” BIOMEDO 17, 0705051–0705053 (2012). [DOI] [PubMed] [Google Scholar]
- 16.Wang RK, Zhang A, Choi WJ, Zhang Q, Chen C.-l.,Miller A, Gregori G, and Rosenfeld PJ, “Wide-field optical coherence tomography angiography enabled by two repeated measurements of B-scans,” Opt. Lett 41, 2330–2333 (2016). [DOI] [PMC free article] [PubMed] [Google Scholar]
- 17.Polans J, Cunefare D, Cole E, Keller B, Mettu PS, Cousins SW, Allingham MJ, Izatt JA, and Farsiu S, “Enhanced visualization of peripheral retinal vasculature with wavefront sensorless adaptive optics optical coherence tomography angiography in diabetic patients,” Opt. Lett 42, 17–20 (2017). [DOI] [PMC free article] [PubMed] [Google Scholar]
- 18.Yun SH, Boudoux C, Tearney GJ, and Bouma BE, “High-speed wavelength-swept semiconductor laser with a polygon-scanner-based wavelength filter,” Opt. Lett 28, 1981–1983 (2003). [DOI] [PubMed] [Google Scholar]
- 19.Huber R, Wojtkowski M, and Fujimoto JG, “Fourier domain mode locking (FDML): A new laser operating regime and applications for optical coherence tomography,” Opt. Express 14, 3225–3237 (2006). [DOI] [PubMed] [Google Scholar]
- 20.Klein T, Wieser W, Reznicek L, Neubauer A, Kampik A, and Huber R, “Multi-MHz retinal OCT,” Biomed. Opt. Express 4, 1890–1908 (2013). [DOI] [PMC free article] [PubMed] [Google Scholar]
- 21.Grulkowski I, Liu JJ, Potsaid B, Jayaraman V, Lu CD, Jiang J, Cable AE, Duker JS, and Fujimoto JG, “Retinal, anterior segment and full eye imaging using ultrahigh speed swept source OCT with vertical-cavity surface emitting lasers,” Biomed. Opt. Express 3, 2733–2751 (2012). [DOI] [PMC free article] [PubMed] [Google Scholar]
- 22.American National Standard for Safe Use of Laser, Z136.1–2014 ed. (Laser Institute of America, 2014). [Google Scholar]
- 23.Liu G, Jia Y, Pechauer AD, Chandwani R, and Huang D, “Split-spectrum phase-gradient optical coherence tomography angiography,” Biomed. Opt. Express 7, 2943–2954 (2016). [DOI] [PMC free article] [PubMed] [Google Scholar]
- 24.Kolb JP, Klein T, Kufner CL, Wieser W, Neubauer AS, and Huber R, “Ultra-widefield retinal MHz-OCT imaging with up to 100 degrees viewing angle,” Biomed. Opt. Express 6, 1534–1552 (2015). [DOI] [PMC free article] [PubMed] [Google Scholar]
- 25.Wang Z, Lee H-C, Ahsen OO, Lee B, Choi W, Potsaid B, Liu J, Jayaraman V, Cable A, Kraus MF, Liang K, Hornegger J, and Fujimoto JG, “Depth-encoded all-fiber swept source polarization sensitive OCT,” Biomed. Opt. Express 5, 2931–2949 (2014). [DOI] [PMC free article] [PubMed] [Google Scholar]
- 26.Su JP, Li Y, Tang M, Liu L, Pechauer AD, Huang D, and Liu G, “Imaging the anterior eye with dynamic-focus swept-source optical coherence tomography,” BIOMEDO 20, 126002–126002 (2015). [DOI] [PMC free article] [PubMed] [Google Scholar]
- 27.Tao YK, Srivastava SK, and Ehlers JP, “Microscope-integrated intraoperative OCT with electrically tunable focus and heads-up display for imaging of ophthalmic surgical maneuvers,” Biomed. Opt. Express 5, 1877–1885 (2014). [DOI] [PMC free article] [PubMed] [Google Scholar]
- 28.Vakoc B, Yun S, de Boer J, Tearney G, and Bouma B, “Phase-resolved optical frequency domain imaging,” Opt Express 13, 5483–5493 (2005). [DOI] [PMC free article] [PubMed] [Google Scholar]
- 29.Braaf B, Vermeer KA, Vienola KV, and de Boer JF, “Angiography of the retina and the choroid with phase-resolved OCT using interval-optimized backstitched B-scans,” Opt Express 20, 20516–20534 (2012). [DOI] [PubMed] [Google Scholar]
- 30.Choi W, Potsaid B, Jayaraman V, Baumann B, Grulkowski I, Liu JJ, Lu CD, Cable AE, Huang D, Duker JS, and Fujimoto JG, “Phase-sensitive swept-source optical coherence tomography imaging of the human retina with a vertical cavity surface-emitting laser light source,” Opt Lett 38, 338–340 (2013). [DOI] [PMC free article] [PubMed] [Google Scholar]
- 31.Liu G, Rubinstein M, Saidi A, Qi W, Foulad A, Wong B, and Chen Z, “Imaging vibrating vocal folds with a high speed 1050 nm swept source OCT and ODT,” Opt Express 19, 11880–11889 (2011). [DOI] [PMC free article] [PubMed] [Google Scholar]
- 32.Liu G, Tan O, Gao SS, Pechauer AD, Lee B, Lu CD, Fujimoto JG, and Huang D, “Postprocessing algorithms to minimize fixed-pattern artifact and reduce trigger jitter in swept source optical coherence tomography,” Opt. Express 23, 9824–9834 (2015). [DOI] [PMC free article] [PubMed] [Google Scholar]
- 33.Heintzmann R, “Band-limit and appropriate sampling in microscopy,” in Cell Biology: A Laboratory Handbook, Celis JE, ed. (Elsevier Academic Press., 2006). [Google Scholar]
- 34.Su JP, Chandwani R, Gao SS, Pechauer AD, Zhang M, Wang J, Jia Y, Huang D, and Liu G, “Calibration of optical coherence tomography angiography with a microfluidic chip,” BIOMEDO 21, 086015–086015 (2016). [DOI] [PMC free article] [PubMed] [Google Scholar]
- 35.Yang J, Su J, Wang J, Men S, Jia Y, Huang D, and Liu G, “Hematocrit dependence of flow signal in optical coherence tomography angiography,” Biomed. Opt. Express 8, 776–789 (2017). [DOI] [PMC free article] [PubMed] [Google Scholar]