. 2018 Sep 1;2(3):381–396. doi: 10.1162/netn_a_00042

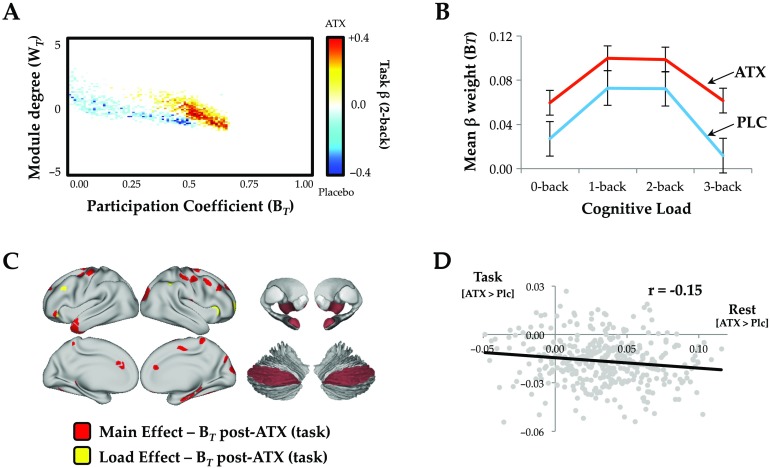
Figure 2. . (A) Mean cartographic profile across all four blocks of load comparing post-ATX to postplacebo; similar patterns were observed in each block (FDR q ≤ 0.05). (B) Mean parcelwise B for each N-back load in both the placebo (PLC, blue) and atomoxetine (ATX, red) conditions (error bars represent standard error across subjects). (C) Parcels with higher BT post-ATX as a function of task performance (FDR q ≤ 0.05); main effect (red) and load effect (yellow). (D) Correlation between the regions that showed highest BT during task performance (ATX > Placebo) and regions that were shifted toward segregation in the rest study (ATX(Post>Pre) > Placebo(Post>Pre)); see Supporting Information Table S1 (Shine et al., 2018) for parcel MNI coordinates (FDR q ≤ 0.05). Key: ATX, atomoxetine; BT, between-module connectivity; WT, within-module connectivity.

Figure 2.