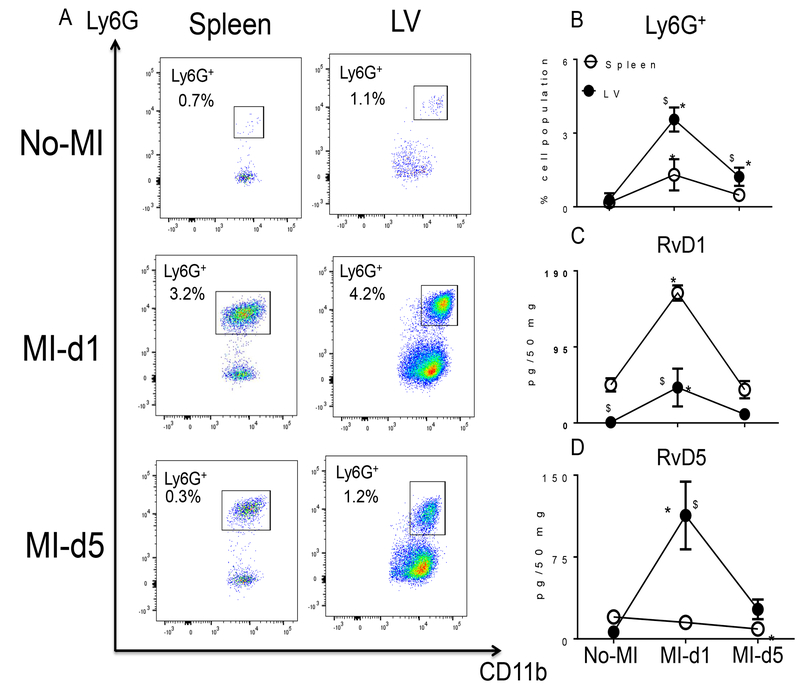
Figure 4. Infarcted LV contains activated leukocytes and SPM biosynthesis is increased in spleen and infarcted myocardium post-MI.
A. Representative flow cytometry (FACs) dot plots showing the neutrophil population (CD11b+/Ly6G+) in spleen (left panel) and LV mononuclear cells (right panel) in no-MI naïve control and at d1 and d5 post-MI. B. Line graph showing the percentage of the Ly6G+ population in spleen and LV mononuclear cells at d0, and d1 and d5 post-MI. n=4 mice/group/day. C. Line graph showing the kinetics of RvD1 in LV and spleen in no-MI control and at d1 and d5 post-MI. n=4 mice/group/day. D. Line graph showing the kinetics of RvD5 in LV and spleen at d1 and d5 post-MI compared to spleen and LV d0 naïve controls. n=4 mice/group/day. Quantification and values in C and D are pg/50 mg of spleen or infarcted LV tissue from apex to base. *p<0.05 compared to no-MI naïve control and $p<0.05 compared to spleen at respective day time point using one way ANOVA.

