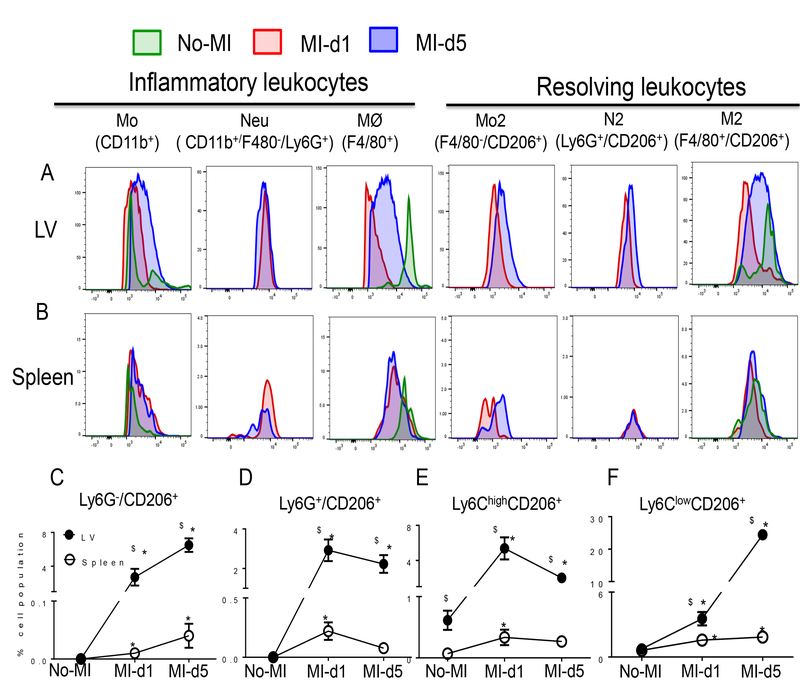
Figure 6. Leukocyte activation in infarcted LV and spleen is associated with overlapping inflammatory and resolving phenotypes.
A. Representative histogram overlay of inflammatory and resolving leukocytes in LV. n=4 mice/group/day. B. Representative histogram overlay of inflammatory and resolving leukocytes in spleen. n=4 mice/group/day. C-F. Line graphs showing the kinetics of the C. Ly6G−/CD206+ D. Ly6G+/CD206+ E. Ly6Chigh/CD206+ F. and Ly6Clow/CD206+ populations in LV and spleen. Results are expressed as mean±SEM, n=4 mice/group/day. *p<0.05 compared to no-MI naïve control and $p<0.05 compared to spleen at respective day time point using one way ANOVA (Mo; monocytes, Neu; Neutrophils, M⊘; macrophages; N2 resolving neutrophils, M2; resolving macrophages)

