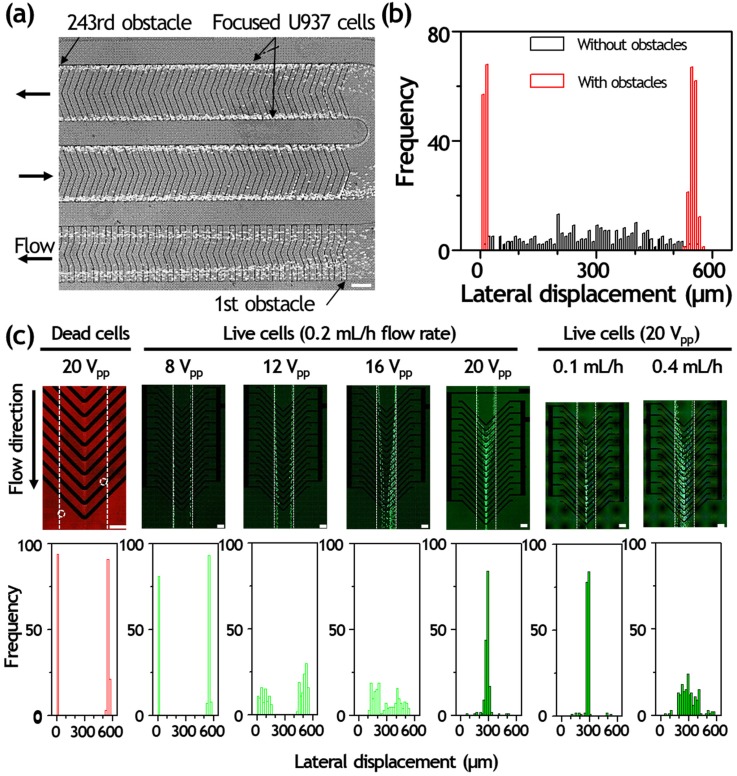
FIG. 3.
Dielectrophoretic live cell sorting of hydrodynamically separated cancer cells. (a) Fluorescence streak images of U937 cells in the grooved microchannel. The cells are successfully guided by locally patterned slanted grooves and focusing efficiency is improved with increasing number of obstacles. Input flow rate is 0.2 ml/h. (b) Cell measurement according to the existence of obstacle array was performed at the end of focusing zone (width of 562 μm) under the input flow rate of 0.2 ml/h and plotted in the focusing histograms. Each focusing histogram was obtained from the measurement of more than 180 cells. (c) Continuous sorting of dead and live U937 cells under the different voltage (8 to 20 Vpp) and flow rate conditions (0.1 to 0.4 ml/h). Each focusing histogram was obtained from the measurement of more than 180 cells. The channel wall is outlined with dotted lines for clarity. Scale bars, 200 μm.

