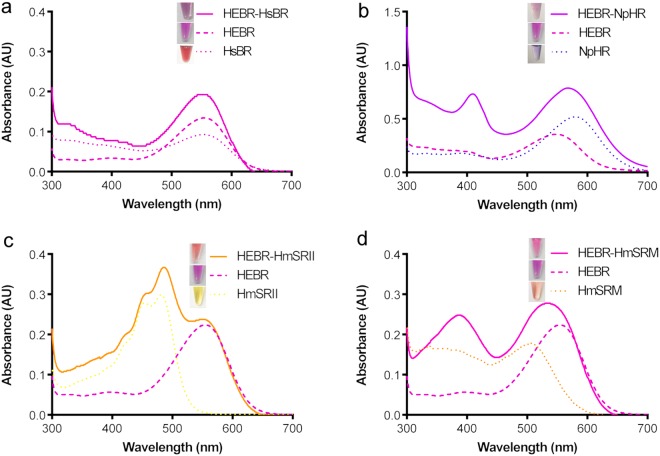
Figure 3.
UV-Vis spectrum analysis and visual colors of HEBR fusion proteins. Four separate measurements of absorbance spectra were plotted in the same chart: solely HEBR (bold dashed), target protein (dashed) and fusion protein (solid): (a) HEBR-HsBR, (b) HEBR-NpHR, (c) HEBR-HmSRII and (d) HEBR-HmSRM. The visual color of purified proteins (inlet of their corresponding figure). All the samples were prepared in 50 mM MES, 4 M NaCl, pH 5.8, containing 0.05% DDM.

