Figure 4.
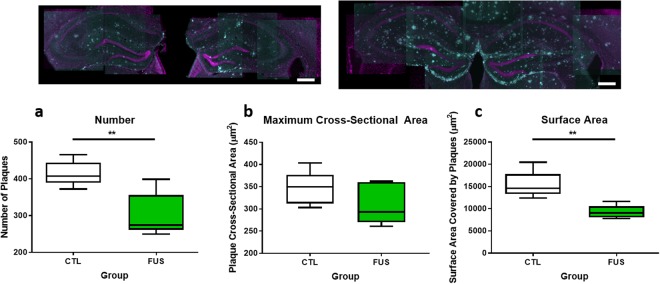
Boxplots showing comparisons of plaque number and surface area between Tg FUS and Tg CTL animals. Top: Representative maximum projection images of hippocampi in Tg FUS (left) and Tg CTL (right) animals (magenta = NeuN, cyan = 6F3D). Bottom: Plaque number (a) in Tg FUS mice decreased significantly by 27 ± 7% compared to Tg CTL littermates (300 ± 30 and 420 ± 20, respectively, p = 0.006). Maximum cross-sectional area of plaques (b) in Tg FUS mice was comparable to that observed in Tg CTL littermates (350 ± 20 and 310 ± 20 µm2, respectively, p = 0.24). Plaque surface area (c) in Tg FUS mice decreased significantly by 40 ± 10% compared to Tg CTL littermates (9270 ± 660 and 15400 ± 1360 µm2, respectively, p = 0.004). Data tables can be found in Supplementary Table S13. Error bars show mean ± SD, n = 5 for each group, **p ≤ 0.01.

