Figure 1.
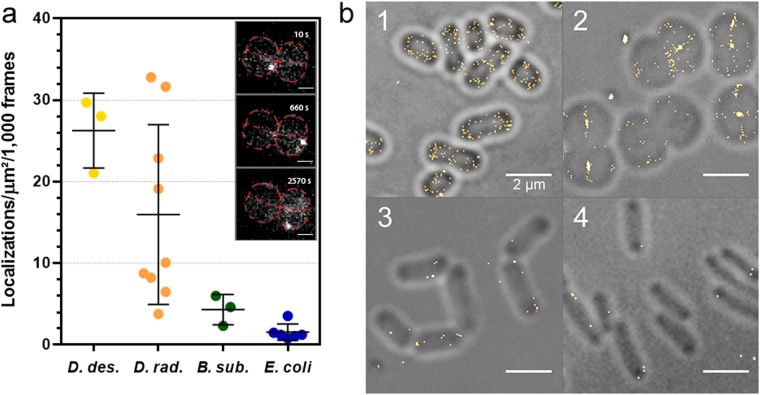
Autoblinking levels in D. deserti, D. radiodurans, B. subtilis and E. coli. (a) Number of localizations per μm2 per 1000 frames extracted from images acquired with 50 ms exposure under continuous 0.8 kW/cm2 561 nm laser. Individual data points correspond to the autoblinking levels derived from a given stack of images. Means and standard deviations are plotted in the graph. Inset: examples of raw autoblinking signal (bright white spots) observed in the cell periphery of a D. radiodurans tetrad (outlined in red and presented in Fig. 2) at different timepoints during image acquisition (see also Supplementary Movie S1). Scale bar: 1 μm. (b) Representative reconstructions of live, unlabeled D. deserti (1), D. radiodurans (2), B. subtilis. (3) and E. coli (4) superimposed on their respective brightfield images. In each case, the reconstructed images are derived from a stack of 1000 frames of 50 ms exposure acquired under continuous 0.8 kW/cm2 561 nm laser. Scale bar: 2 μm.

