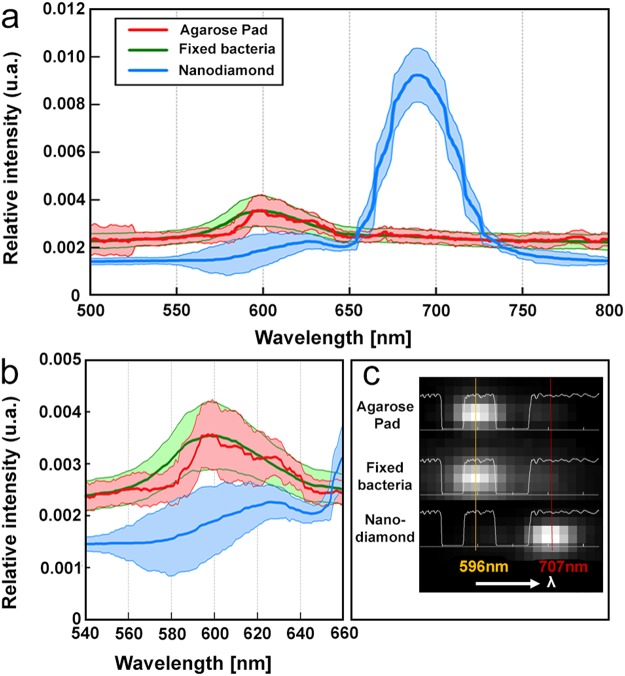
Figure 4.
Single-molecule spectral imaging of molecules on the surface of the agarose pads (red), of autoblinking molecules in fixed D. radiodurans cells (green), and of nanodiamonds (blue). (a) Average emission spectra (500 nm to 825 nm) derived from 34, 1221 and 1013 individual spectra respectively. (b) Inset of (a) focusing on the 540 nm to 660 nm wavelength range. (c) Examples of raw spectra produced by molecules on the agarose pad, within fixed bacterial samples and by nanodiamonds. In light white is represented the Quad band notch spectrum used for the acquisition on the spectral channel.

