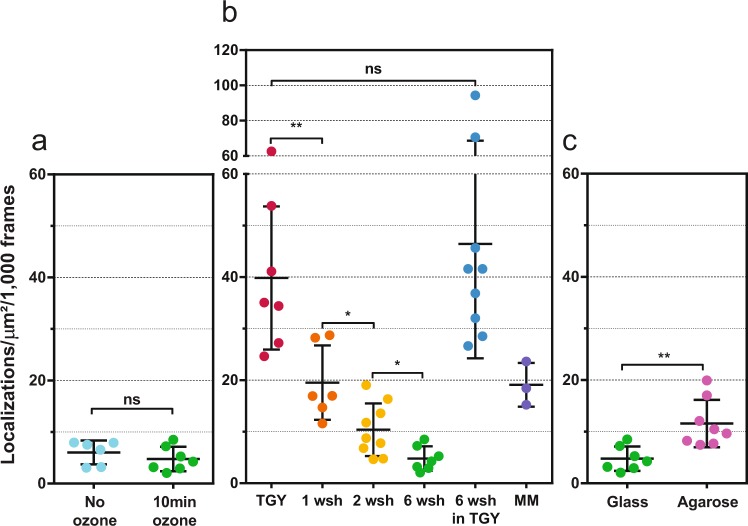
Figure 5.
Comparative study of the autoblinking levels in fixed, unlabeled D. radiodurans cells. (a) Effect of ozone treatment of glass coverslides on the number of localizations in cells per µm2 per 1000 frames. (b) Effect of TGY growth medium and washes with highly pure PBS prior to sample mounting on the number of localizations in cells per µm2 per 1000 frames. TGY grown cells were either deposited directly between coverslides (TGY) or were washed once (1 wsh), twice (2 wsh) or 6 times (6 wsh) prior to imaging. A sample of cells washed 6 times with PBS was also resuspended again in TGY medium (6 wsh in TGY) before imaging. Cells initially grown in TGY and then transferred to minimal medium (MM) for 24 hours were also imaged. (c) Effect of the agarose pad on the number of localizations in cells per µm2 per 1000 frames. All images were acquired with a 50 ms frametime under continuous 0.8 kW/cm2 561 nm laser. Individual data points correspond to the autoblinking levels derived from a given stack of images. Means and standard deviations are plotted in the graph.

