Figure 6.
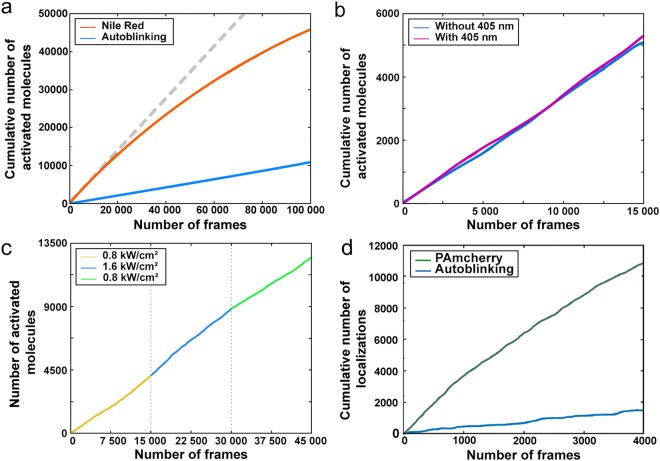
Photophysical properties of autoblinking molecules. (a) Cumulative number of autoblinking molecules (blue) under constant 561 nm laser illumination (0.8 kW/cm2), compared to Nile Red (orange). Accumulation of autoblinking molecules follows a linear regression, while that of Nile Red progressively slows down during the data acquisition. (b) Cumulative number of activated autoblinking molecules under constant 561 nm laser illumination (0.8 kW/cm2) in the presence (violet) and absence (blue) of constant 405 nm illumination. (c) Cumulative number of activated autoblinking molecules under varying 561 nm laser illumination (0.8 kW/cm2, yellow; 1.6 kW/cm2, blue; 0.8 kW/cm2, green). Accumulation of autoblinking molecules follows a linear progression and is only marginally affected by the increased laser power. (a-c) Images were acquired with a 50 ms timeframe. (d) Cumulative number of localizations of cytoplasmic PAmCherry (green) expressed in D. radiodurans and of autoblinking molecules (blue). PAmCherry localizations were acquired first using a 5 ms timeframe, constant 561 nm illumination (0.8 kW/cm2) and varying 405 nm laser, and once all the PAmCherry molecules had been bleached, the autoblinking molecules were imaged under constant 561 nm illumination (0.8 kW/cm) and with 50 ms timeframes.

