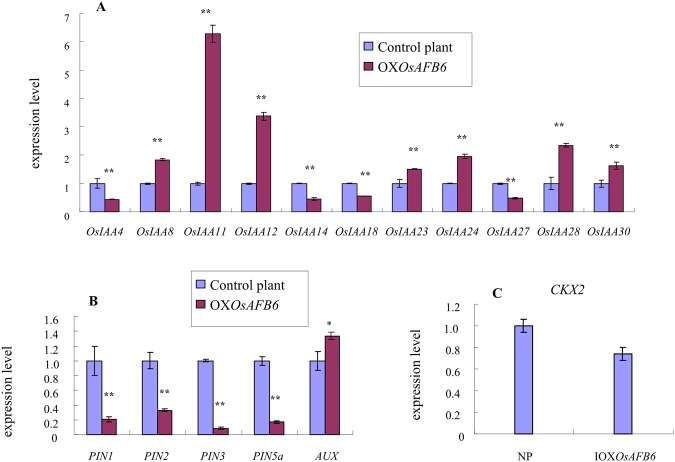
Figure 6.
Differentially expressed genes in young panicles by real-time PCR. (A) The expression level of OsIAA/AUX family genes. (B) The expression level of auxin transporter genes. (C) CKX2 expression level. OXOsAFB6 and control plants represent the OsAFB6 overexpression mutant and Zhonghua 11 plant as the negative control, respectively. The expression levels of each gene in the control plants were marked as 1. Error bars, standard deviation. *, ** Indicates significance at the level of P < 0.05 and 0.01, respectively.

