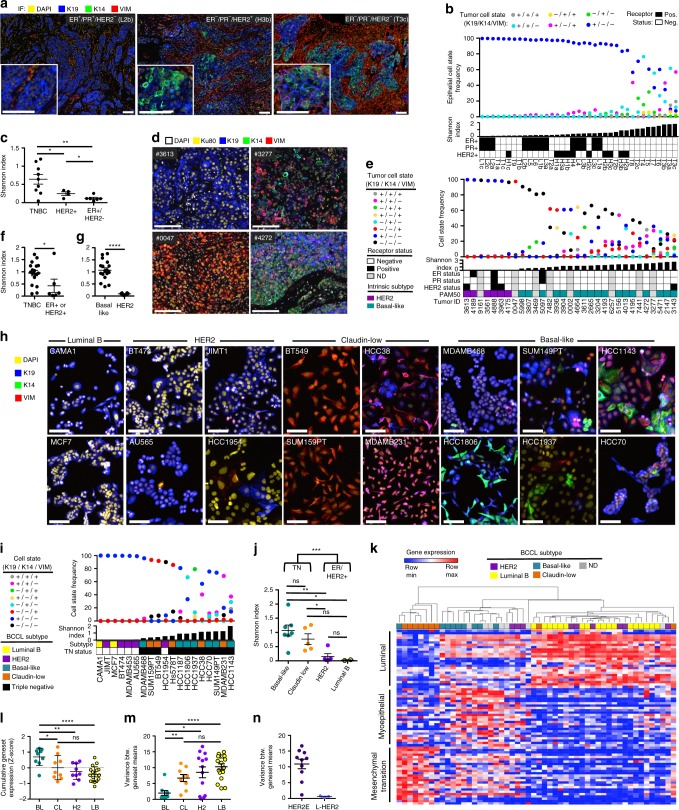
Fig. 1.
Differentiation-state heterogeneity is enriched in the triple negative and basal-like subtypes. a Representative IF images of treatment-naïve primary breast cancers: “luminal” (ER+/PR+/HER2−), HER2+ (ER+/−/PR−/HER2+), and triple negative (ER−/PR−/HER2−), scale bars = 100 μm. b The frequency of six epithelial cell states is shown for each tumor region in a vertical scatterplot with accompanying Shannon diversity index and ER, PR, and HER2 status. Luminal (L), HER2+ (H), and TN (T) tumor regions are arranged left to right by increasing Shannon index, regions of the same tumor denoted by “a, b, c” e.g., L2a, L2b, L2c. c Graph comparing Shannon index between tumors of different hormone receptor subtype (multiple regions of individual tumors are averaged if available), asterisks denote significance *P < 0.05, **P < 0.01. SEM shown. d IF images of PDX tumors with low (left panels) and high (right panels) Shannon indices stained for DAPI (white), Ku80 (yellow), K19 (blue), K14 (green) and VIM (red), scale bars = 100 μm. e The frequency of eight tumor cell states based on K19, K14, and VIM expression is shown for 31 PDX tumors in a vertical scatterplot with accompanying Shannon index. Patient ER, PR, and HER2-receptor status and intrinsic molecular subtype is shown. Tumors arranged left to right by increasing Shannon index. f, g Graphs of Shannon index, comparing tumors with differing receptor-positivity status and molecular subtype. *P < 0.05, ****P < 0.0001. SEM shown. h IF images of BCCLs with differing molecular subtypes, scale bars = 100 μm. i The frequency of eight cell states based on K19, K14, and VIM expression is shown for each BCCL in a vertical scatterplot with accompanying Shannon index, molecular subtype and Triple negative (TN) status is indicated (denoted by color, marked by black squares). Cell lines are arranged left to right by increasing Shannon index. j Graph of Shannon index, comparing TN and non-TN BCCLs, as well as different molecular subtypes. *P < 0.05, **P < 0.01, ***P < 0.001, ns = not significant, SEM shown. k Heatmap of BCCL gene expression of 25 luminal, 25 myoepithelial, and 25 EMT-correlated genes. BCCLs are arranged by unsupervised clustering. Cell line molecular subtype is denoted by color. l Graph of the cumulative Z-score of the luminal, myoepithelial, and EMT genesets in BCCLs of different molecular subtype, basal-like (BL), claudin-low (CL), HER2+ (H2), and Luminal B (LB), *P < 0.05, **P < 0.01, ****P < 0.0001, ns = not significant, SEM shown. m Graph of the variance between the mean geneset expression of the luminal, myoepithelial, and EMT genesets in BCCLs of different molecular subtype, asterisks denote significant difference in geneset variance, SEM shown. n Graph of the variance between HER2+ cell lines that are either of the L-HER2 or HER2E molecular subtypes

